Trading position (short-term): no positions.
On Tuesday, crude oil gained 1.86% as data showed that the index of consumer confidence improved and colder-than-normal temperatures fueled concerns about oil distribution and tightening petroleum product supplies.
Yesterday, the Conference Board showed that its index of consumer confidence improved to 80.7 this month (analysts expected the index to rise to 78.1) from a downwardly revised 77.5 in December. These better-than-expected numbers boosted hopes that the world’s biggest oil-consuming country will demand more fuel and energy.
Oil prices were also supported by worries that another Arctic blast across the Midwest and Eastern U.S. would drain heating fuel inventories (potentially boosting demand) and could disrupt oil distribution.
Please note that the EIA will release its inventories report later in the day. Analysts expect the report will show that domestic crude stockpiles climbed more than 2 million barrels in the week ended Jan. 24. If the forecast is correct, it would be the second straight weekly increase for domestic oil supplies, following seven weeks of declines.
As a reminder, investors are also looking ahead to the outcome of the Federal Reserve’s monthly meeting later today.
Having discussed the above, let’s move on to the technical changes in the crude oil market (charts courtesy of http://stockcharts.com.)

In our last Oil Trading Alert, we wrote:
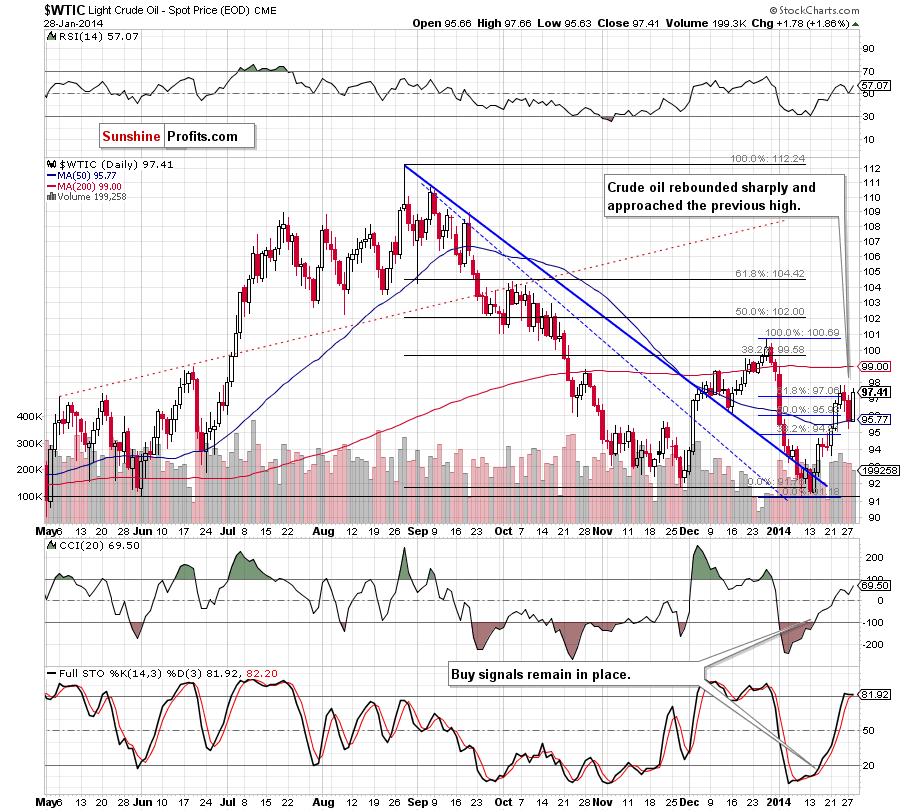
(…) crude oil extended declines and dropped to the 50-day moving average. (…) light crude also reached the 38.2% Fibonacci retracement level based on the recent rally (at $95.32). If this strong support zone encourages oil bulls to act, we will likely see an upward corrective move in the near future. Please note that this scenario is reinforced by the position of the indicators (they are not overbought at the moment and buy signals remain in place supporting buyers).
Looking at the above chart, we clearly see that oil bulls realized their own pro growth scenario and crude oil rebounded sharply yesterday. With this upswing, light crude climbed above the 61.8% Fibonacci retracement level once again and approached the January high. Although this is a bullish sign, this upward corrective move materialized on relative low volume. Taking this fact into account, it seems that the buyers may not have enough strength to push the price higher at the moment. If this is the case, we may see another downswing and the first important support would be the 50-day moving average (currently at $95.77), which successfully stopped sellers yesterday.
Nevertheless, taking into account the position of the indicators (buy signals remain in place supporting buyers), we may see another attempt to move higher. In this case, if oil bulls manage to push light crude above the Jan. 23 high, we will likely see further improvement and the upside target will be the 200-day moving average (currently at $99).
Having discussed the current situation in light crude, let’s take a look at WTI Crude Oil (the CFD).

Quoting our last Oil Trading Alert:
(…) the CFD dropped to the 38.2% Fibonacci retracement which intersects with the blue dashed support line. Although this support levels encouraged buyers to act, the price still remains below the 50-day moving average which serves as resistance now (…). If it is broken, we will likely see further improvement and the first upside target will be yesterday’s high.
On the above chart, we see that the breakout above the 50-day moving average encouraged oil bulls to act and resulted in an upswing. With this move the CFD not only broke above Monday’s high, but also approached to the 200-day moving average once again. As you see on the daily chart, this strong resistance (in combination with the 127.2% Fibonacci projection) stopped the buyers yesterday and it seems that as long as WTI Crude Oil remains below this strong resistance zone, further gains are limited.
If this area encourages the sellers to act, we will likely see another downswing (especially when we factor in sell signals generated by the indicators) and the first downside target will be the 50-day moving average and the next- yesterday’s low (slightly above the very short-term dashed support line). On the other hand, if the buyers manage to break above the strong resistance (which would be a strong bullish signal), we will see further improvement and the upside price target will be around $98.47-$98.78 where the 76.4% and 78.6% Fibonacci retracements are.
Summing up, crude oil rebounded sharply and approached the January high. Although this is a bullish sign, the situation is a bit unclear because this upswing materialized on relative low volume and the indicators (on the WTI Crude Oil chart) generated sell signals. Additionally, in both cases, the price remains close to strong resistance zones, which suggests caution and indicates that another downswing can’t be ruled out.
Very short-term outlook: mixed
Short-term outlook: bullish
MT outlook: bullish
LT outlook: mixed
Trading position (short-term): We do not suggest opening any positions at the moment. We will keep you informed should anything change, or should we see a confirmation/invalidation of the above.
Thank you.
Nadia Simmons
Forex & Oil Trading Strategist
Forex Trading Alerts
Oil Investment Updates
Oil Trading Alerts


