
On Monday, crude oil lost 0.98% as disappointing U.S. home sales figures and profit taking pushed the price lower. With this downswing light crude slipped below the psychologically important level of $100 per barrel.
Yesterday, the National Association of Realtors reported that its pending home sales index increased by a seasonally adjusted 0.2% in November, far below market expectations for a 1.0% gain. Pending home sales for October were revised to a 1.2% decline from a previously reported drop of 0.6%. This disappointing news fueled concerns that the U.S. housing sector, which drove the country into the worst recession since the Great Depression and has dragged on its recovery ever since, continues to face headwinds today and the U.S. economy continues to battle potholes on its road to recovery and may demand less fuel and energy than once anticipated.
On top of that, Libya's national oil company, the Arabian Gulf Oil Co., announced on its website on Monday that it had resumed some oil field and refinery operations the day before, which added selling pressure.
Having discussed the above, let’s move on to the technical changes in the crude oil market (charts courtesy of http://stockcharts.com).
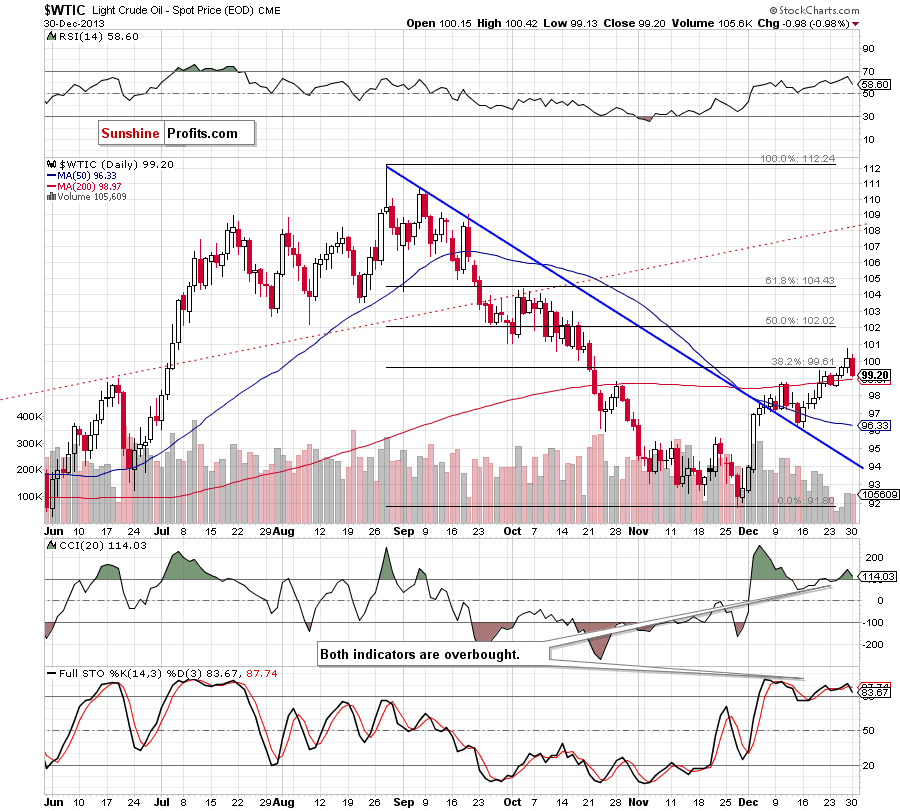
Looking at the above chart, we see that the situation has deteriorated slightly as crude oil invalidated breakouts above the 38.2% Fibonacci retracement level and the psychological barrier of $100. An invalidation of the breakout is a bearish signal by itself, therefore, we could see a correction in the coming day (or days). As you can see on the above chart, light crude declined, but it still remains above the previously-broken 200-day moving average. If this support is broken, the first downside target will be around $98.53 where the Dec. 24 low is.
At this point, it’s worth noting that the CCI and Stochastic Oscillator are overbought and close to generating sell signals. As you can see on the above chart, we saw a similar situation earlier this month. Back then, an invalidation of the breakout above the 200-day moving average triggered a downward move, which pushed the price to the short-term support line (you can read more about that correction here). If history repeats itself, and the price drops below this moving average, we will likely see further deterioration.
Before we move on to the WTI Crude Oil chart, we would like to draw your attention to the long-term crude oil chart.
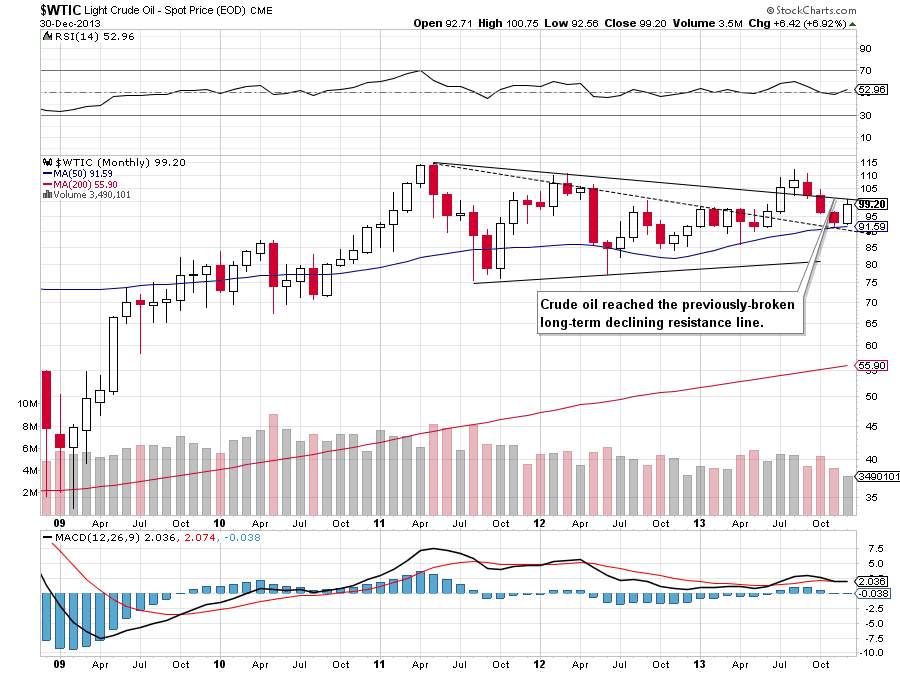
Looking at the monthly chart, we see that crude oil reached the previously-broken long-term declining resistance line, which may encourage oil bears to trigger a correction in the coming days. Nevertheless, the bullish engulfing pattern that you can notice on the above chart still supports the bullish case in the long term.
Having discussed the current situation in crude oil, let’s take a look at WTI Crude Oil (the CFD).
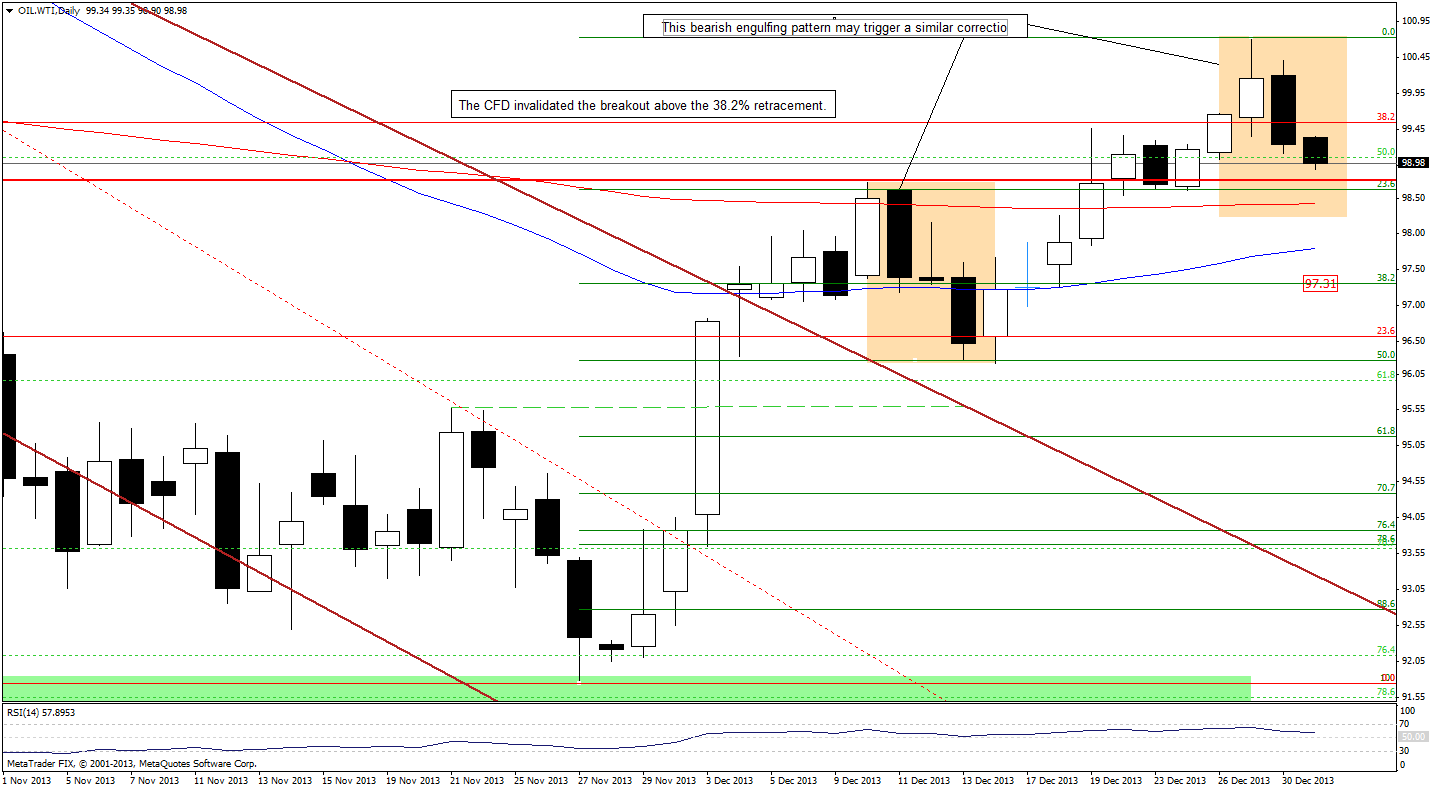
On the above chart, we see that WTI Crude Oil invalidated breakouts above the 38.2% Fibonacci retracement level and the psychological barrier of $100, which is a bearish signal. Additionally, we have a bearish engulfing pattern, which will likely encourage oil bears to trigger a corrective move in the near future. If we see such price action, the first downside target will be the 200-day moving average (currently at $98.42). If it is broken, the next target for the sellers will be the 38.2% Fibonacci retracement level based on the entire Nov.-Dec. rally around $97.30.
Once we know the above, let’s take a look at the NYSE Arca Oil Index (XOI) chart.
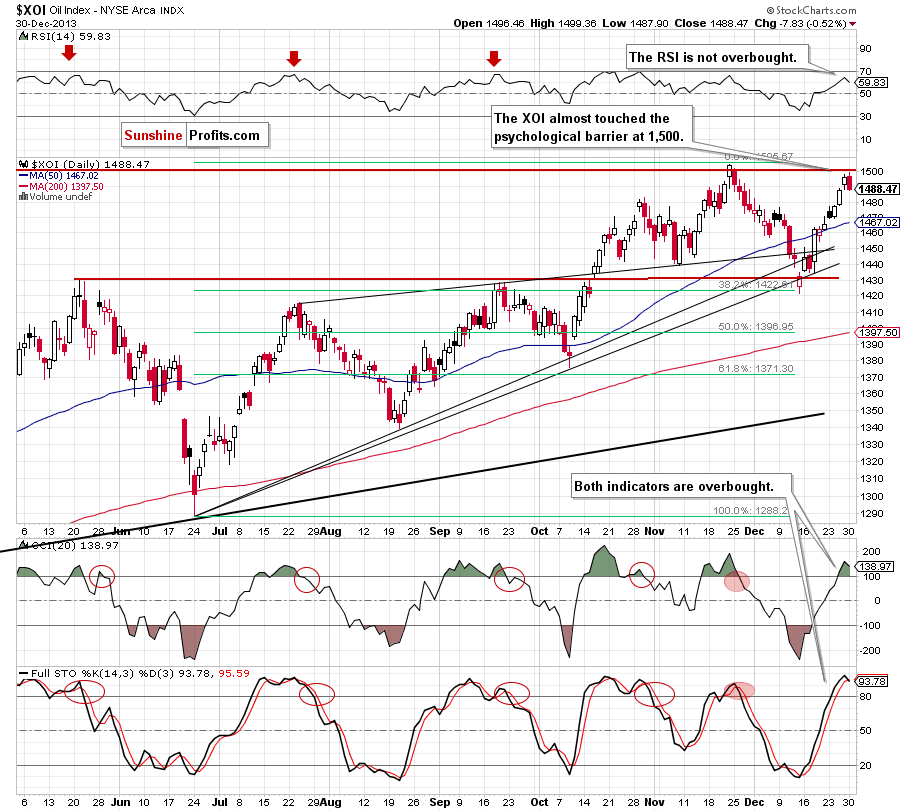
Looking at the above chart, we see that the situation has deteriorated slightly. Yesterday, after the market open, the XOI extended gains and hit a daily high at 1,499. With this upswing, the oil stock index almost touched the psychological barrier at 1,500. However, this strong resistance level encouraged sellers to act and resulted in a decline below 1,490. When we take a closer look, we see that yesterday’s candlestick together with the previous one create a bearish engulfing pattern. Taking this fact into account and combining it with the proximity to the psychological barrier at 1,500 and the position of the indicators, it seems that we may see a correction in the coming days.
Summing up, crude oil invalidated breakouts above the 38.2% Fibonacci retracement level and the psychologically important level of $100, which is a negative signal for the buyers. Although the situation remains bullish from the technical point of view, at the moment, it seems that the above in combination with the long-term declining resistance line and the position of two indicators will likely trigger a bigger correction in the coming days. Additionally, a bearish engulfing pattern on the CFD chart will likely encourage oil bears to act, which may translate to lower prices of crude oil after the market open. On top of that, we noticed one more important thing. In recent days, crude oil and the oil stock index have moved higher together. If this positive correlation remains in place, we will likely see lower values of crude oil and oil stocks (taking into account the current situation in both cases).
Very short-term outlook: mixed
Short-term outlook: bullish
MT outlook: bullish
LT outlook: mixed
Trading position (short-term): We might see a bigger corrective move when crude oil breaks below the 200-day moving average, so we suggest closing long positions and taking profits off the table. We will keep you informed should anything change, or should we see a confirmation/invalidation of the above.
Finishing today’s Oil Trading Alert, I would like to wish you a Happy and Profitable New Year.
Thank you.
Nadia Simmons
Forex & Oil Trading Strategist
Oil Investment Updates
Oil Trading Alerts

