
On Friday, crude oil closed lower for the fourth day in a row and lost 1.70%. Light crude extended losses after positive U.S. manufacturing data fueled the idea that the Federal Reserve will taper its stimulus program sooner than expected. In this way, the price dropped to a new four-month low of $94.36.
The Institute of Supply Management's Manufacturing Purchasing Managers Index rose to 56.4 in October from 56.2 in September, defying expectations for a decline to 55.0. The report came a day after data showed that manufacturing activity in the Chicago region expanded at the fastest rate in 30 years in October, while a separate report showed that U.S. initial jobless claims fell in line with expectations last week.
Just like the day before, stronger than expected data fueled speculation that the Fed may start to roll back its monetary stimulus in December, instead of March as many currently expect, weighing on most commodities.
In our previous Oil Trading Alert, we wrote that expectations that the Fed might start curbing its bond purchases by the end of this year had fueled declines in the prices of riskier assets before investor focus shifted to the wobbly fiscal situation in Washington from late September. Therefore, stronger than expected data raised speculation that the Fed may start tapering stimulus sooner than expected and pushed crude oil lower once again.
Please note that another big event for markets will be Friday's U.S. payrolls report which is expected to show a modest rise of just 125,000 in October, amid some uncertainty about the impact of the government shutdown. Also of note will be the U.S. gross domestic product (GDP) due on Thursday, expected to show annualized growth of 1.9 percent in the third quarter, down from 2.5 percent the previous quarter.
Keep in mind that a soft report, and particularly any rise in the jobless rate, would lean against the Fed tapering in December.
Having discussed the above, let’s move on to the technical changes in the crude oil market (charts courtesy of http://stockcharts.com).
On Friday, the situation deteriorated once again. Similarly to what we saw on Thursday, after the open oil bulls managed to push the price higher, but it didn’t even reach the previously-broken lower border of the declining trend channel. This show of weakness encouraged sellers to act and resulted in a heavy decline, which took the price below the October low. With this downward move, light crude dropped below $95 and reached the lower border of the declining trend channel in terms of daily closing prices.
Please note that the Friday’s drop resulted in a breakdown below the long-term support line based on the July 2008 and February 2012 highs.
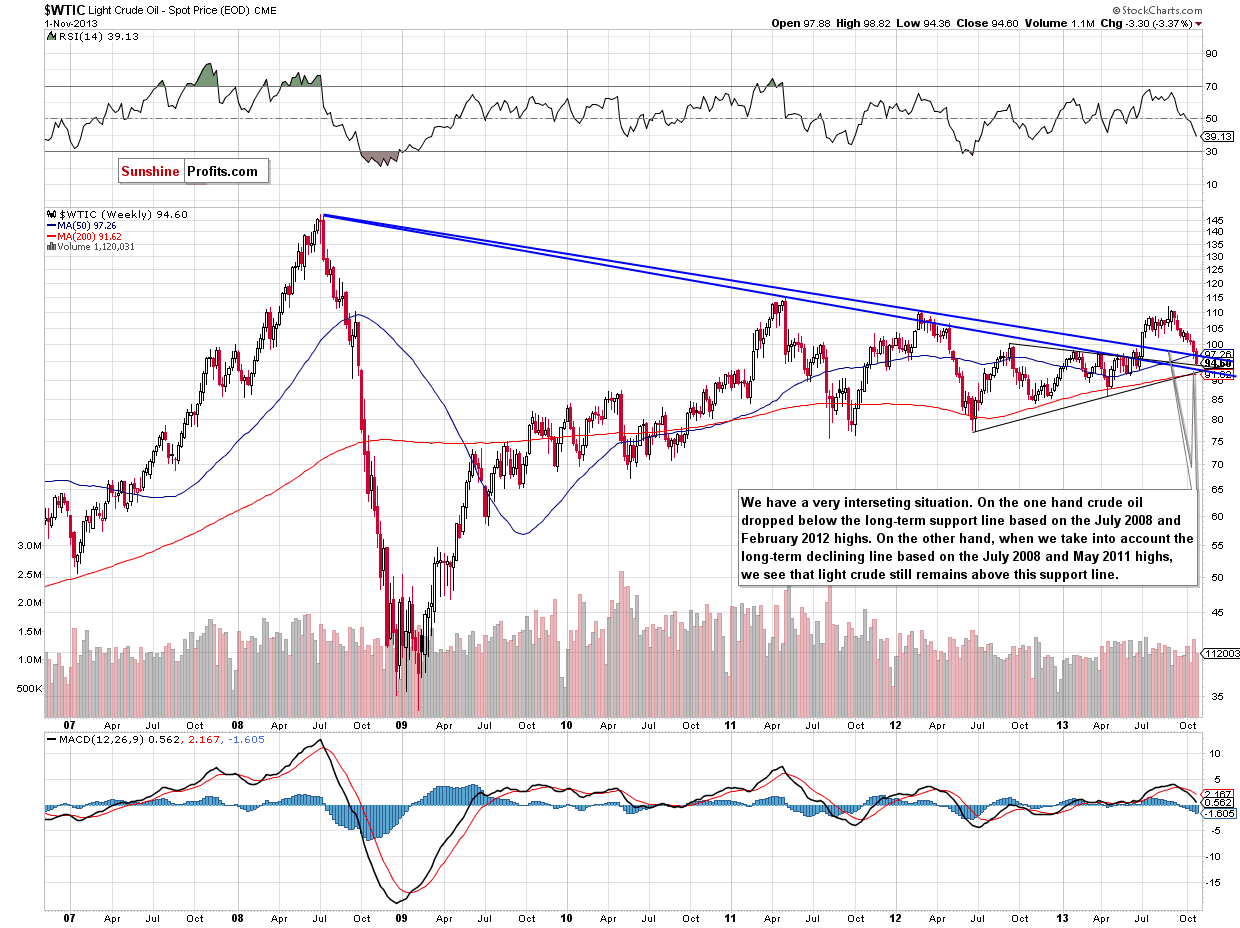
However, if we draw the long-term support line based on the July 2008 and May 2011 highs we’ll see that crude oil still remains above this support line. From this point of view, the long-term picture is unclear and we will wait 2 more days for the situation to clarify.
Nevertheless, on the short-term basis crude oil is extremely oversold – the RSI dropped below the 30 level to its lowest level since April. Additionally, light crude reached the lower border of the declining trend channel in terms of daily closing prices and the 50% Fibonacci retracement level based on the entire June 2012-August 2013 rally. Taking only these facts into account, further declines may be decelerated in the coming days.
Before we summarize, let’s move on to the XOI daily chart.
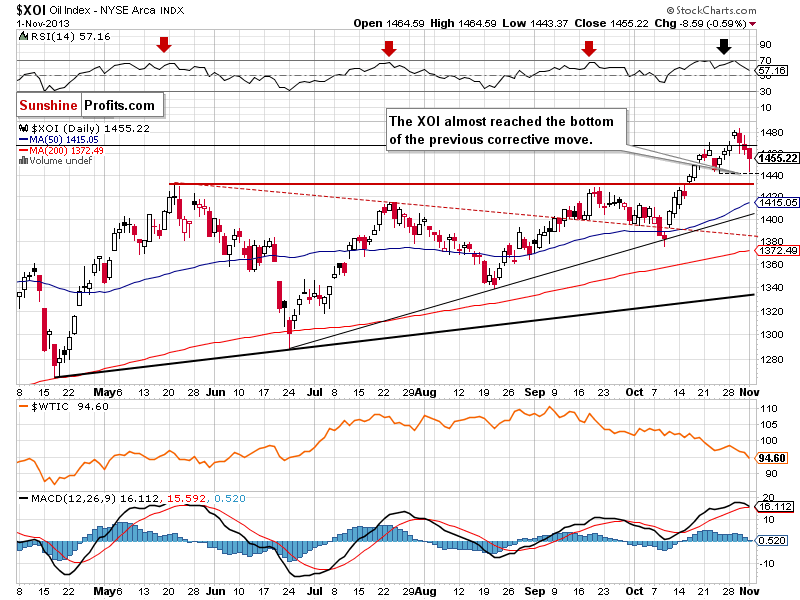
Quoting our previous Oil Trading Alert:
(…) the XOI declined below the previously-broken 78.6% Fibonacci retracement level (…), the breakout above this important resistance was invalidated. This is a bearish sign, which may lead to further deterioration – especially when we factor in the RSI indicator.(…) we should keep in mind that the RSI bounced off the 70 level, which is a bearish sign. Therefore, we may see a corrective move in the following days. Please note that we saw similar price action several times in the previous months (marked with red arrows on the above chart).The nearest support level is the bottom of the recent corrective move at 1,441.
Looking at the above chart, we see that the oil stock index declined on Friday and hit its daily low at 1,443. However, the nearest support level encouraged buyers to act and resulted in a pullback to 1,455. If they do not give up, we will likely see further growth to the 78.6% Fibonacci retracement level. On the other hand, if the XOI drops below the Friday low, the next support zone will be at 1,428-1,430 (it is based on the May and September highs).
Summing up, on one hand we just saw a breakdown below the major long-term support line, but on the other hand, crude oil is extremely oversold on a short-term basis. Last week's final days were very volatile in the currency markets, and breakouts/breakdowns seen there were not confirmed. We could still see a move in the opposite direction in the Euro and USD Indices, which could lead to invalidation of breakouts / breakdowns in other markets. We will wait 2 more days for the situation to clarify and if the breakdowns/breakouts in the currency markets hold along with the long-term breakdown in the crude oil market, we will likely open a speculative short position with a medium-term decline in mind.
Very short-term outlook: bearish
Short-term outlook: bearish
MT outlook: mixed
LT outlook: bullish
Trading position (short-term): We do not suggest opening short positions yet. Taking into account the long-term picture, the situation is unclear.
Thank you.
Nadia Simmons
Sunshine Profits' Crude Oil Expert
Oil Investment Updates
Oil Trading Alerts

