
On Wednesday, crude oil extended declines after the EIA showed that crude oil stocks rose more than expected last week. This weekly report fueled concerns over a slowdown in demand from the world’s largest oil consumer. In this way, light crude lost 1.17% and slipped below $97 per barrel once again.
The U.S. Energy Information Administration said in its weekly report that U.S. crude oil inventories rose by 4.1 million barrels in the week ended Oct. 25, well above expectations for an increase of 2.3 million barrels.
Crude stocks have gained 28.2 million barrels, or 7.9%, in the past six weeks as refiner demand has dropped amid seasonal maintenance work and unplanned outages. Total U.S. crude oil inventories stood at 383.9 million barrels, which is their highest level since June 21, but are the most ever for this time of year on EIA weekly data, which began in 1982. The EIA data also showed that crude oil stocks are near the highest end-October level since 1930.
Just like a week ago, we clearly see that Wednesday’s build put a lot of pressure on the oil market and that surplus definitely weighed on prices. Taking the above into account, we can conclude that there are a lot of stocks of crude oil in the U.S. Therefore, fundamentally, the oil market is not so strong, but technically WTI could rebound if the buyers manage to hold the October low.
Once we know the current situation in U.S. crude oil inventories, which has had a great impact on the price of light crude, let’s move on to the technical changes in the crude oil market (charts courtesy of http://stockcharts.com).
Quoting our previous Oil Trading Alert:
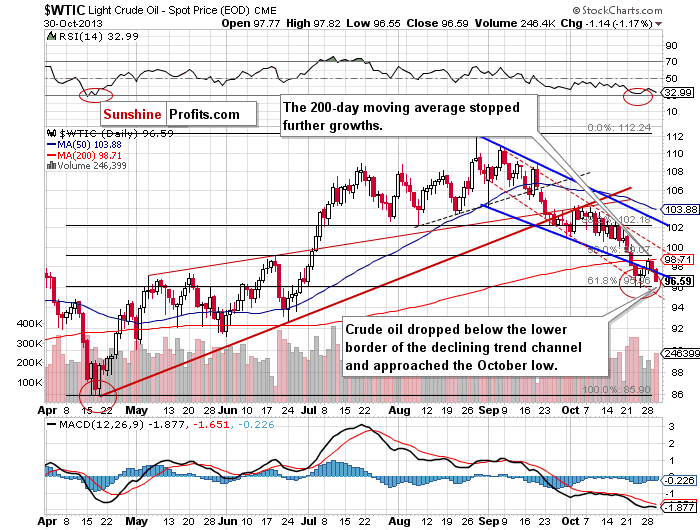
(…) oil bulls didn’t have enough strength to push the price above the 200-day moving average (…) crude oil declined and reached the lower border of the declining trend channel. If the price of light crude drops below this line, we will see further deterioration and oil bears will likely test the October low.
Looking at the above chart we see that after the open oil bulls didn’t manage to push the price higher. This show of weakness triggered a downward move, which took crude oil below the lower border of the declining trend channel. This deterioration encouraged sellers to act and light crude dropped to a daily low of $96.55. Taking these facts into account, we may see a test of the October low. If the buyers manage to hold this level, we will likely see a pullback to the 200-day moving average. However, if it is broken, we may see further declines to at least $95. Please note that in this area is the lower border of the declining trend channel in terms of daily closing prices. This line successfully stopped the recent corrective move, as seen on the chart.
With Wednesday’s decline, crude oil reached a strong support zone based on the 50-week moving average, the previously-broken neck level (created by the April and May highs) of the reverse head and shoulders formation and the 61.8% Fibonacci retracement level based on the entire April-August rally once again.
Before we summarize, let’s move on to the XOI daily chart.
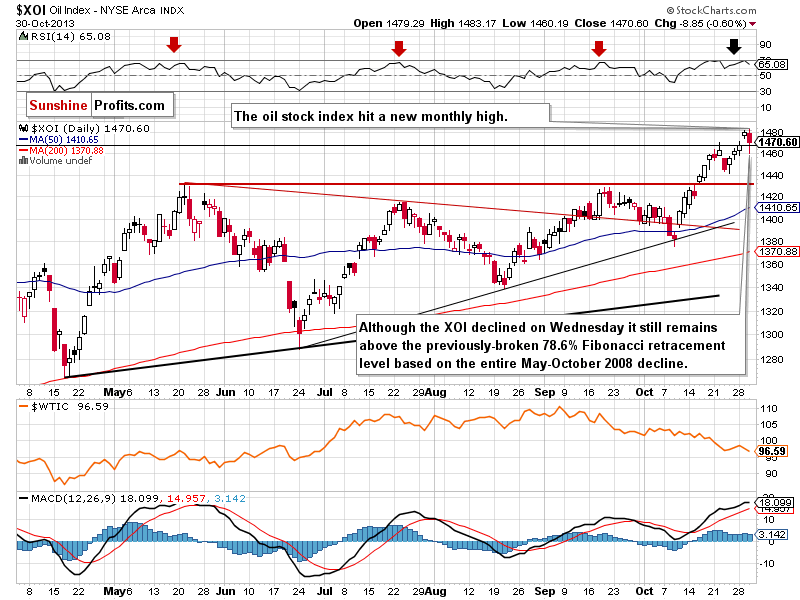
Yesterday, after the market’s open, the oil stock index continued its rally and hit a fresh monthly high at 1,483. However, this improvement was only temporary and in the following hours the XOI declined below the previously-broken 78.6% Fibonacci retracement level (close to 1,467) based on the entire May-October 2008 decline. In spite of this drop, the XOI closed the day above this level, which means that the breakout was not invalidated. From this point of view, further growth seems quite likely.
On the other hand, we should keep in mind that the RSI bounced off the 70 level, which is a bearish sign. Therefore, we may see a corrective move in the following days. Please note that we saw similar price action several times in the previous months (marked with red arrows on the above chart).
The next support level is the bottom of the recent corrective move at 1,441. A further one lies at 1,428-1,430 and it is based on the May and September highs.
Summing up, the price of light crude bounced off the lower border of the declining trend channel, which is a bearish sign. Therefore, a test of the October low should not surprise us.
Very short-term outlook: bearish
Short-term outlook: bearish
MT outlook: mixed
LT outlook: bullish
Trading position (short-term): we do not suggest opening short positions yet. As long as crude oil remains above a strong support zone based on the 50-week moving average, the previously-broken neck level of the reverse head and shoulders formation and the 61.8% Fibonacci retracement level based on the entire April-August rally, further declines are limited.
Thank you.
Nadia Simmons
Sunshine Profits' Crude Oil Expert
Oil Investment Updates
Oil Trading Alerts

