
On Wednesday, crude oil lost 1.23% after the EIA data showed that U.S. crude oil inventories posted their biggest weekly decline in nearly a year, while gasoline supplies climbed more than expected amid weak demand. In this way, light crude erased almost the entire Tuesday increase and closed the day below $98 per barrel.
Yesterday, the U.S. Energy Information Administration said in its weekly report that U.S. crude oil inventories fell by 10.59 million barrels in the week ended Dec. 6, well beyond expectations for a decline of 2.95 million barrels. However, market participants attributed the large drawdown to fewer crude imports (not an increase in demand) - due in part to inclement weather and a tax assessment, factors that often occur this time of year. As a reminder, in our Oil Trading Alert from Dec. 4 we wrote the following: “historically, refineries try to reduce their crude stockpiles before year-end tax assessments based on storage levels.”
Although this drop was the largest for U.S. supplies since the week ended Dec. 28, it didn’t have a positive impact on crude oil. On top of that, the EIA report also showed that gasoline inventories increased by 6.72 million barrels last week, while distillate stocks, including heating oil and diesel fuel, rose by 4.5 million barrels. It’s worth noting that these gains for both products were the highest since last January, which was an additional bearish factor that sent crude oil lower.
Having discussed the above, let’s move on to the technical changes in the crude oil market (charts courtesy of http://stockcharts.com).
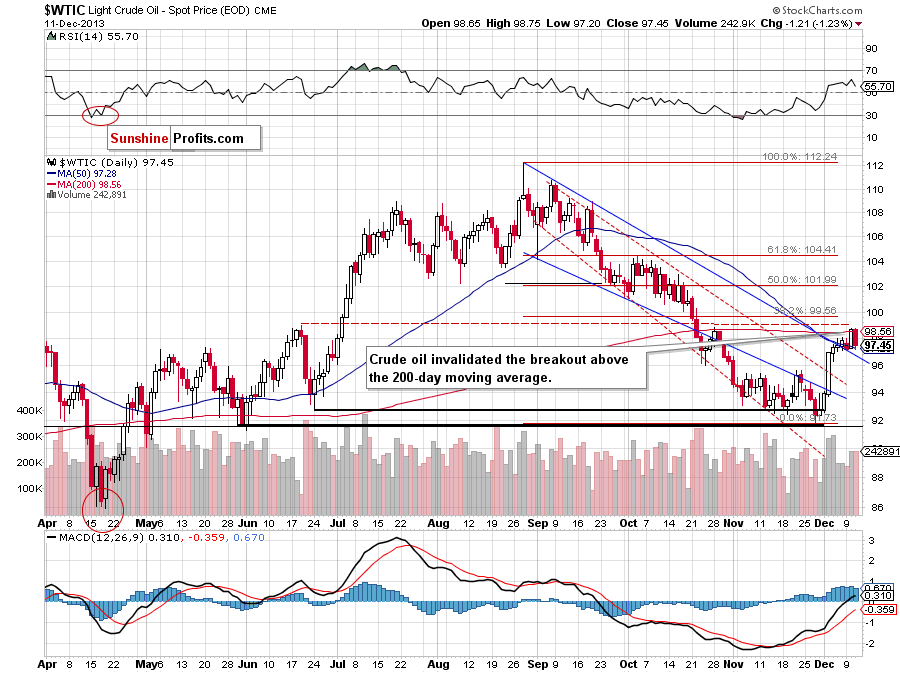
Looking at the above chart, we see that crude oil reversed course and invalidated the breakout above the 200-day moving average, which is not a positive sign for oil bulls – especially when we take into account the fact that this downswing materialized on relatively high volume. Despite this drop, light crude still remains above its 50-day moving average, which decelerated yesterday’s decline. If oil bears show their claws once again and this moving average is broken, the nearest downside target will be the previously-broken upper line of the declining trend channel – currently around $96.40, which will likely stop further deterioration.
Having discussed the current situation in crude oil, let’s take a look at WTI Crude Oil (the CFD).
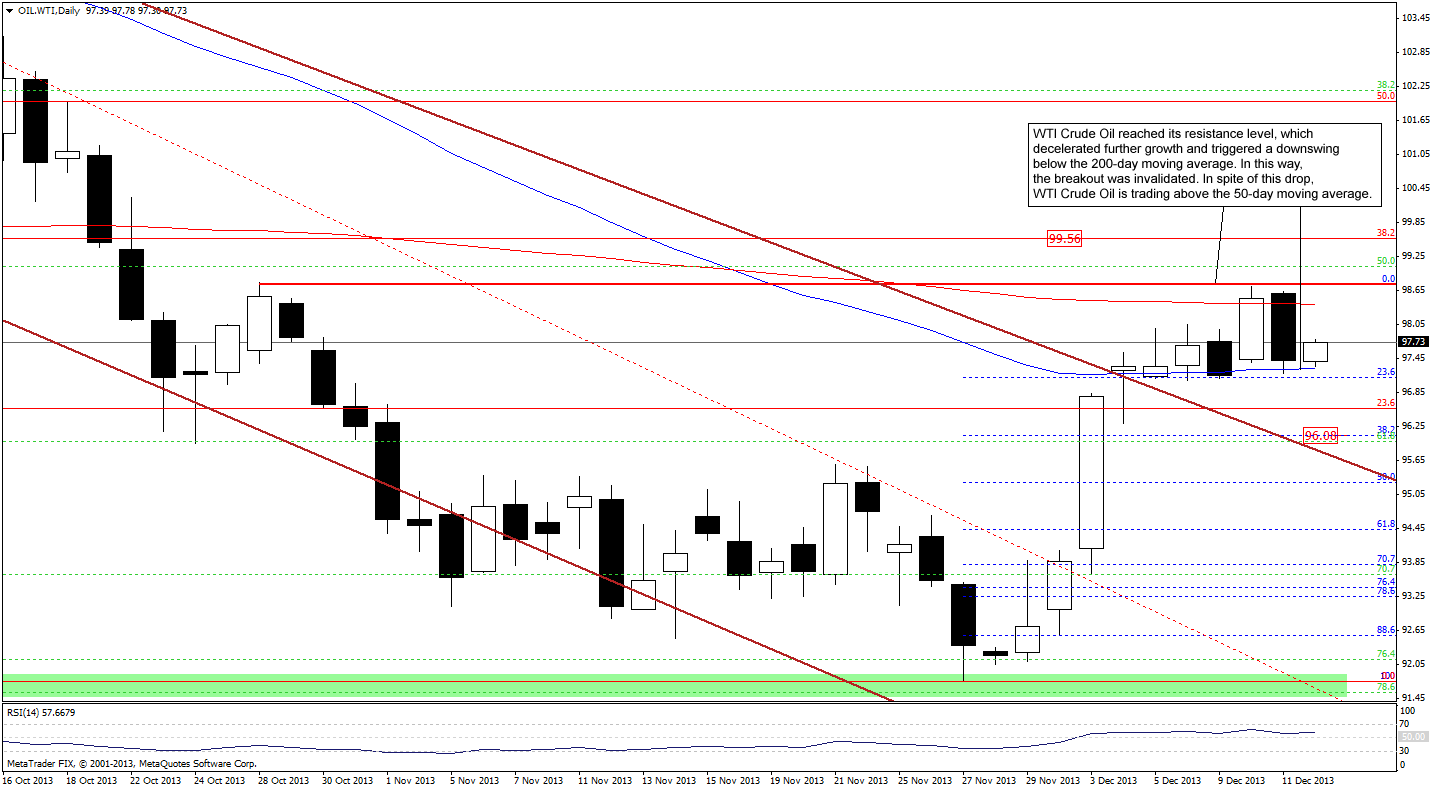
Looking at the above chart, we see that yesterday WTI Crude Oil reached its resistance level, which decelerated further growth and triggered a downswing. With this downward move, the price dropped below the 200-day moving average and the Tuesday breakout was invalidated. Despite this fact, WTI Crude Oil is trading in a narrow range between the 200-day and 50-day moving average.
On the one hand, if we see further deterioration, the first downside target will be around $96 where the 38.2% Fibonacci retracement (based on the entire recent rally) is. On the other hand, if the price climbs above $98.78 (very short-term resistance level), the next price target for buyers will be the 38.2% Fibonacci retracement level (based on the Aug.-Nov. decline) around $99.55.
Taking into account the fact that crude oil and WTI Crude Oil move together in the same direction, it seems that a move in the CFD will trigger a similar move in light crude.
Once we know the above, let’s take a look at the NYSE Arca Oil Index (XOI) weekly chart.
Looking at the above chart, we see that the situation deteriorated significantly yesterday.
Quoting our Oil Trading Alert from Monday:
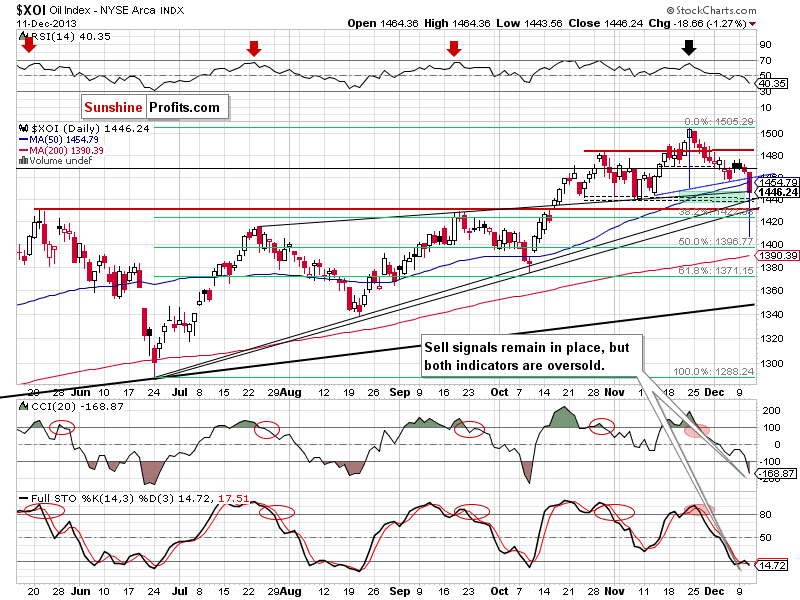
(…) If the XOI moves above 1,475, we may see further improvement and an attempt to move above 1,483 (the previous 2013 top). On the other hand, if oil stocks drop below 1,457, we will likely see further deterioration. In this case, the first downside target will be the 50-day moving average (currently at 1,453). If it’s broken, we may see a downward move to a support zone created by the upper line of the rising wedge (marked with the thin black line) and the bottom of the correction that we saw at the beginning of November (around 1,440-1,446).
As you can see on the above chart, yesterday the oil stock index dropped below 1,457, which encouraged sellers to act. In the following hours, the XOI declined below its 50-day moving average and reached the upper line of the rising wedge. In this way, oil stocks moved to their support zone, which may encourage buyers to push the buy button. If it happens, we may see an upward corrective move to around 1,475.
However, when we take a closer look at the chart, we can notice a head and shoulders pattern. The yesterday drop pushed the XOI below the neck line (marked with blue), which may trigger further deterioration. According to theory, the price target for this formation will be around 1,410. Nevertheless, before the sellers realize their scenario, they will have to push the oil stock index below the support zone.
Summing up, although crude oil invalidated the breakout above the 200-day moving average, it still remains above the 50-day moving average and the previously-broken upper line of the declining trend channel, which serve as support. Yesterday’s corrective move was shallow and it didn’t even erase 25% of the recent rally, therefore, the situation remains bullish.
Very short-term outlook: bullish
Short-term outlook: bullish
MT outlook: mixed with bullish bias
LT outlook: mixed
Trading position (short-term): Long. Stop-loss order for this position: $91.55. Stop-loss order for WTI Crude Oil: $91.30. We will keep you informed should anything change, or should we see a confirmation/invalidation of the above.
Thank you.
Nadia Simmons
Sunshine Profits' Crude Oil Expert
Oil Investment Updates
Oil Trading Alerts

