
On Monday, crude oil extended its decline and lost 0.57% as a nuclear deal between Iran and six world powers eased Middle East geopolitical tensions and raised expectations of increased global production. In this way light crude dropped to slightly above the November low, but then reversed the course and closed the day above $94 per barrel.
In our yesterday’s Oil Trading Alert, we wrote that the nuclear deal signed on Sunday would likely have a negative impact on crude oil. As it turned out, this historic deal with Iran over its nuclear program was the major bearish factor which pushed the price of light crude lower. As a reminder, the U.S. and five other world powers struck a historic accord with Iran, agreeing to ease part of an economic stranglehold in exchange for steps to cap Tehran's nuclear program and ensure the government doesn't rush to develop atomic weapons.
Iran, in return, will gain relief from Western economic sanctions that U.S. officials believe will provide between $6 billion and $7 billion in badly needed foreign exchange for Tehran over the next six months.
Nevertheless, this breakthrough deal will not allow any more Iranian oil into the market, or let western energy investors into the country.
Morgan Stanley said in a note Monday that although progress in the Iran nuclear talks is a "growing bearish risk," any substantial weakness in oil prices due to the agreement is a "potential overreaction."
Taking into account the fact that crude oil reversed the course after it hit a daily low, we can conclude that this development had a limited impact on the physical market.
Having discussed the above, let’s move on to the technical changes in the crude oil market (charts courtesy of http://stockcharts.com).
As we wrote in our Monday’s Oil Trading Alert:
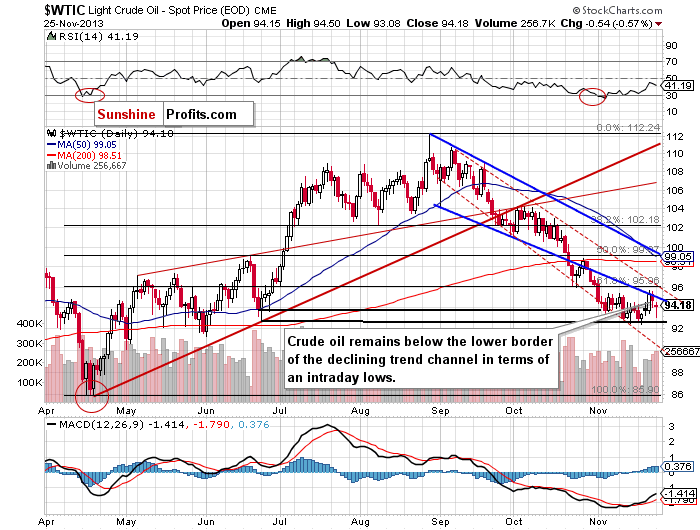
(…) this downward move resulted in a drop below the lower border of the declining trend channel (in terms of intraday lows) and the breakout above this line was invalidated. This is not a positive sign for oil bulls – especially when we take into account the fact that Friday’s downswing materialized on relative high volume. Therefore, further deterioration should not surprise us.
Looking at the above chart, we see that yesterday crude oil declined and dropped to its daily low of $93.08, which is slightly above the November low. However, this deterioration was temporary. Crude oil rebounded quickly and closed the day above $94. Despite this upswing, light crude still remains below the lower border of the declining trend channel in terms of intraday lows, which serves as major short-term resistance.
Nevertheless, if oil bulls do not give up and the price comes back in the range of the declining trend channel (in terms of intraday lows), light crude will likely re-test the strength of the resistance level created by the Nov. 21 high. If it is broken, the first target for the buyers will be the upper border of the declining trend channel in terms of daily closing prices (currently around $96).
Please note that the November low is a major support level – slightly below the bottom of the corrective move that we saw back in June (in terms of intraday lows). The next support zone is at the lower border of the declining trend channel (currently around $90.58).
Once we know the current situation in crude oil, let’s take a look at the NYSE Arca Oil Index (XOI) weekly chart.
As we wrote in our yesterday’s Oil Trading Alert:
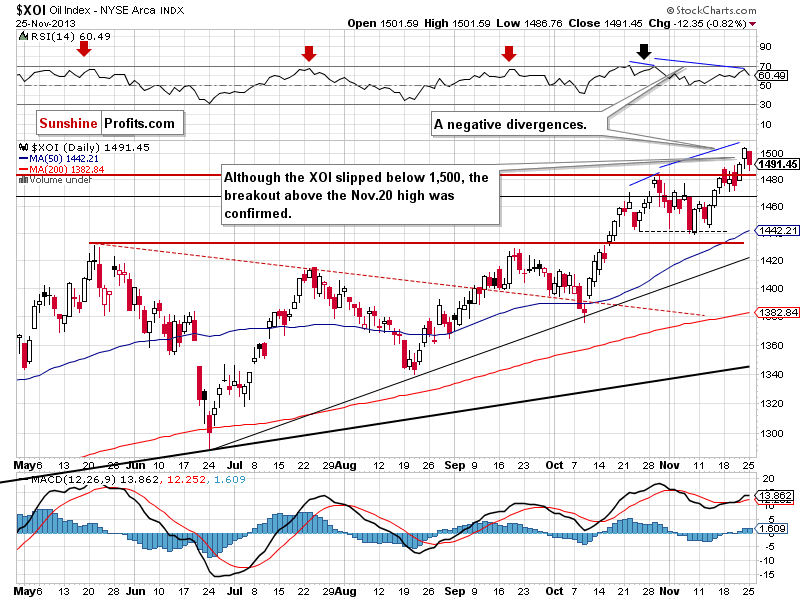
(…) looking at the weekly chart we see that the oil stock index reached another medium-term resistance line created by the September 2012 and May 2013 highs (marked with the blue line). Additionally, the RSI reached its highest level since the beginning of the year and is overbought. Please note that earlier this year, lower readings on the RSI triggered downswings in the XOI. Therefore, from this perspective, another corrective move might be just around the corner.
As you can see on the above chart, the medium-term resistance line encouraged sellers to act and triggered a corrective move, which took the XOI below 1,500. In this way, the breakout above the psychological barrier was invalidated, which is a bearish sign. In spite of this drop, the correction has been shallow so far and another move to the upside is still likely to be seen.
Please note that as long as the oil stock index remains above the October high, space for further declines seems limited.
Summing up, although crude oil dropped to slightly above the November low, oil bulls managed to stop further deterioration and pushed the price higher. Despite this upswing, light crude still remains below the lower border of the declining trend channel in terms of intraday lows, which serves as major short-term resistance. Therefore, it seems that as long as this strong resistance is in play, further growth is limited and a bigger pullback is unlikely. As a reminder, as long as crude oil remains above the long-, medium- and short-term support levels, space for further declines seem limited.
Very short-term outlook: mixed
Short-term outlook: bearish
MT outlook: bearish
LT outlook: unclear
Trading position (short-term): If we see a confirmed breakout in crude oil above the lower border of the declining trend channel in terms of intraday lows (marked with the blue bold line), we will consider opening long positions. Taking into account the long-, medium- and short-term support lines, we do not suggest opening short positions at the moment. We will keep you informed should anything change, or should we see a confirmation/invalidation of the above.
Thank you.
Nadia Simmons
Sunshine Profits' Crude Oil Expert
Oil Investment Updates
Oil Trading Alerts

