
Trading position (short-term; our opinion): No positions.
On Wednesday, light crude lost 2.69% as bearish the EIA weekly report on crude oil inventories weighed on the price. Because of these circumstances, the commodity broke below the long-term support once again, approaching the recent lows. Will we see a double bottom formation?
Yesterday, the U.S. Energy Information Administration reported that U.S. crude oil inventories rose by 7.1 million barrels in the week ended Oct. 17, far outpacing expectations for a gain of 2.7 million barrels. These strong bearish numbers fueled worries that the global market is awash in crude and pushed the commodity to slightly above the recent multi-month low. Will the barrier of $80 encourage oil bulls to act and we’ll see a double bottom formation? Let’s take a look at the technical picture of light crude (charts courtesy of http://stockcharts.com).
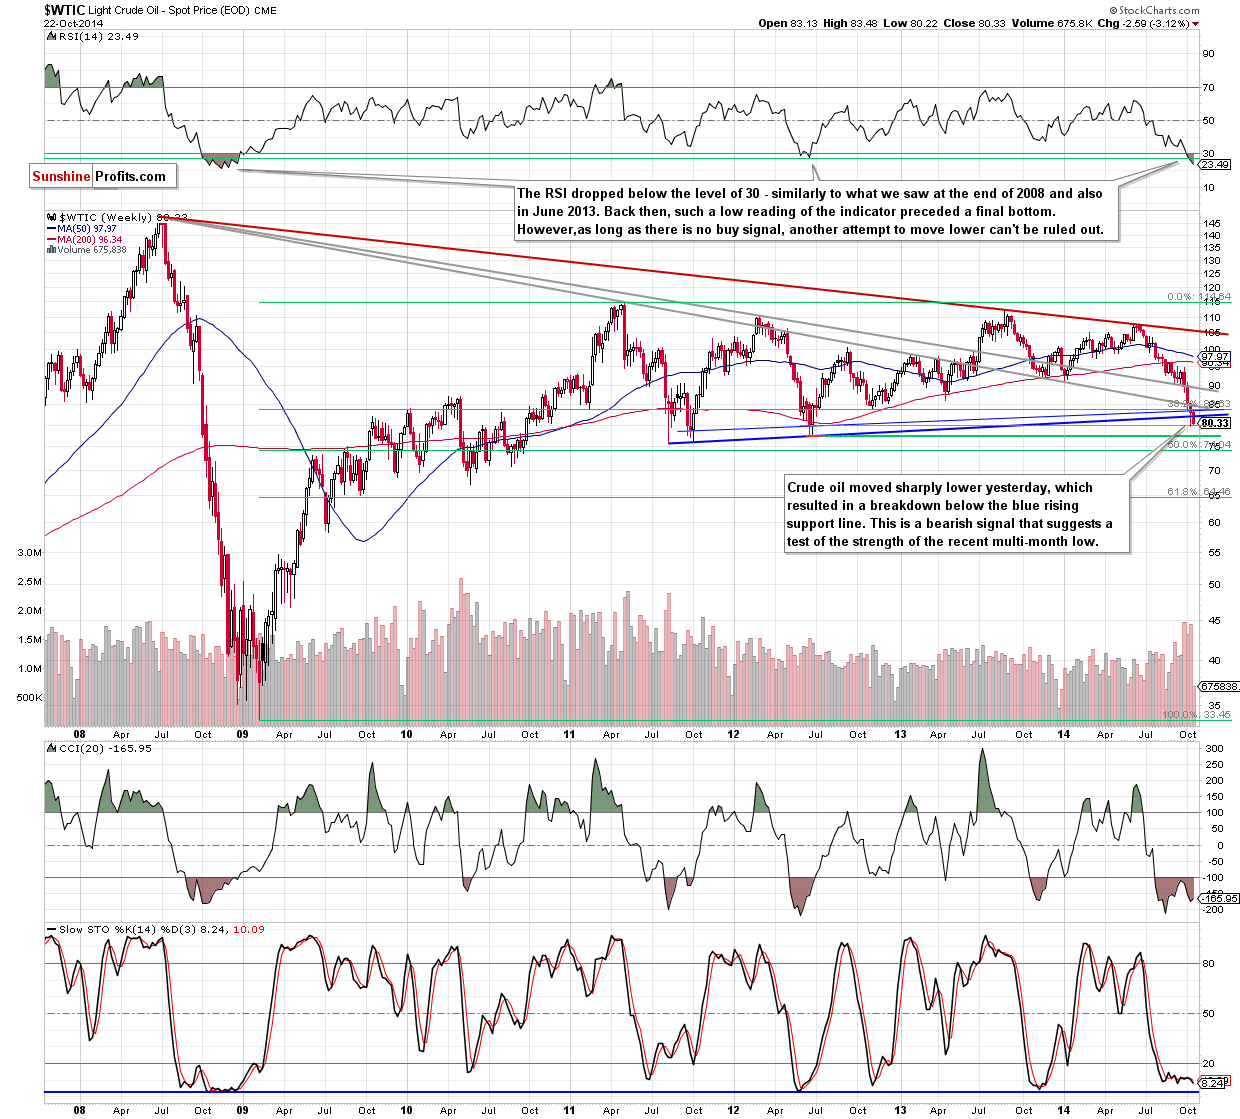
Looking at the above chart, we see that the situation in the medium term has deteriorated as crude oil extended losses and dropped below the blue rising support line once again. Although this is a strong bearish signal that suggests a test of the strength of the recent multi-month low, it seems that as long as the barrier of $80 is in play another sizable downward move is not likely to be seen. Will the very short-term picture give us more clues about future moves? Let’s check.
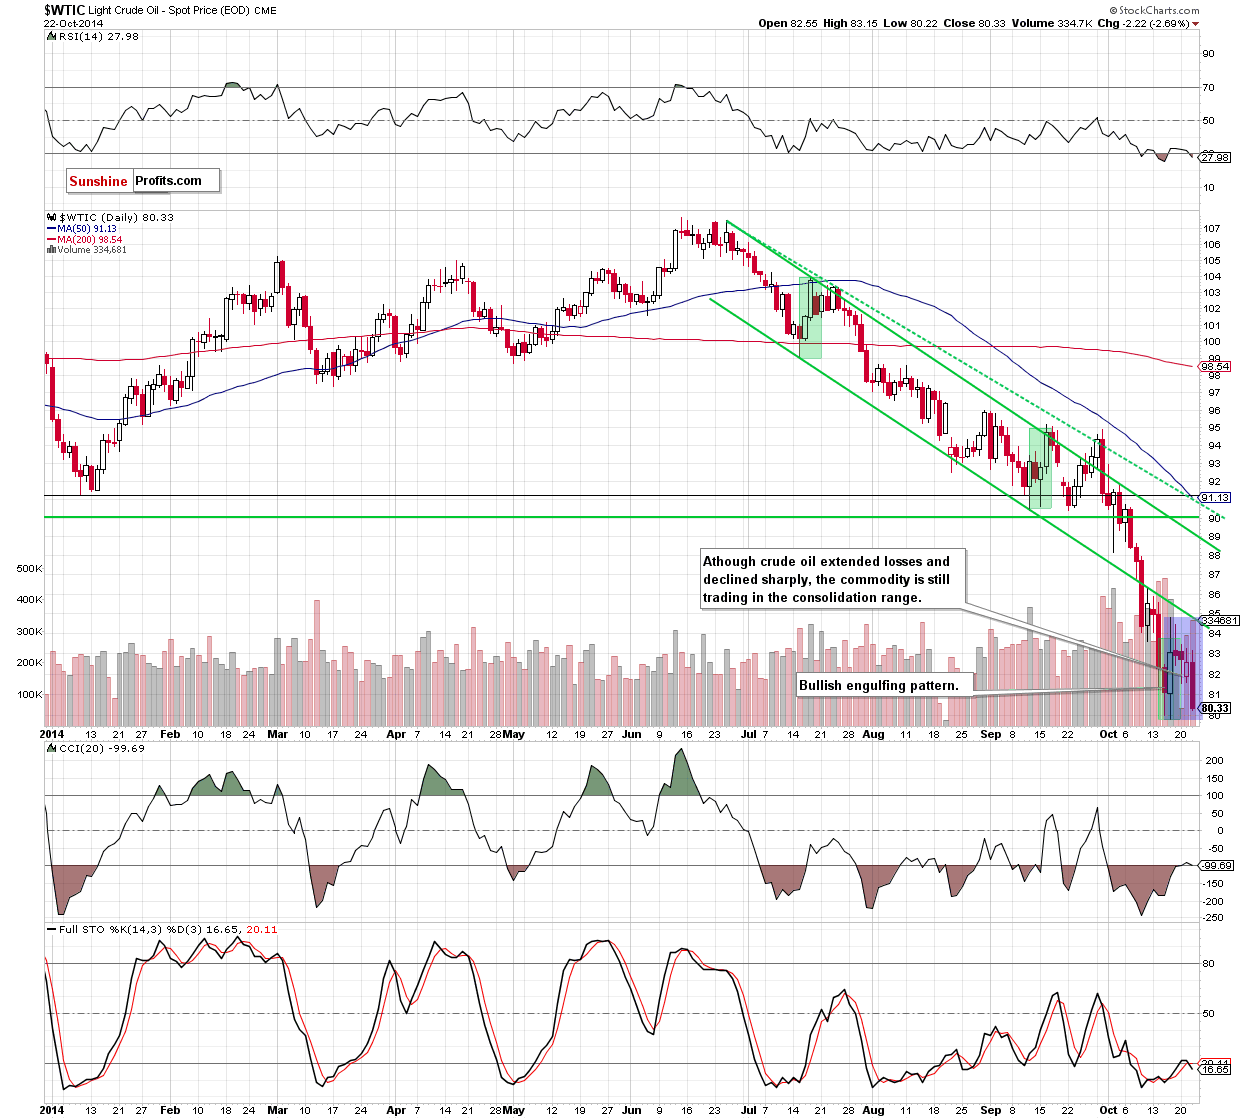
From this perspective, we see that although crude oil declined sharply, the situation in the very short term hasn’t changed much as the commodity is still trading in a consolidation between Oct 16 high and low (marked with blue). As we mentioned earlier, with yesterday’s downswing, light crude approached the recent low, which could encourage oil bulls to act and result in a post-double bottom rally. If this is the case, crude oil will rebound from here in the coming days and the initial upside target would be around $84.45, where the lower border of the declining trend channel and the lower long-term grey resistance line are. Additionally, slightly above these lines is also the upper border of the current consolidation (at $84.83). Therefore, a breakout above such solid resistance zone would be a strong bullish signal that should trigger further improvement and an increase to at least $88.50-$89, where the next resistance zone (created by the upper line of the declining trend channel and the first long-term grey declining line) is. Nevertheless, if oil bulls fail, and the commodity breaks below $79.78, they will find the next support around $77.28, where the Jun 2012 low is.
Summing up, despite yesterday’s sharp decline, the situation hasn’t deteriorated as much as it seems at the first glance because the commodity is still trading in the consolidation. Additionally, if oil bulls take their chance and push crude oil higher, we may see a post-double bottom rally. Nevertheless, as long as light crude remains under the solid resistance zone, we think that staying on the sidelines and waiting for the confirmation that the declines are over is the best choice.
Very short-term outlook: mixed with bullish bias
Short-term outlook: mixed with bullish bias
MT outlook: mixed
LT outlook: bullish
Trading position (short-term; our opinion): No positions.
Thank you.
Nadia Simmons
Forex & Oil Trading Strategist
Przemyslaw Radomski, CFA
Founder, Editor-in-chief
Gold & Silver Trading Alerts
Forex Trading Alerts
Oil Investment Updates
Oil Trading Alerts

