
Trading position (short-term; our opinion): No positions.
Crude oil moved lower today and in today’s session and the commodity moved significantly below our stop-loss level. In other words, the stop-loss took one out of the position before crude oil declined even more. Now, what does it mean in the current market environment? Actually, if we assume that we are likely to see another big upswing in the crude oil anyway, then all the stop-loss did was to save some money from the original trade by taking one out at a higher price and allowing one to re-enter lower. Is crude oil still likely to move visibly higher? Yes. Is there a good, yet temporary reason for which the crude oil has fallen so badly? Yes.
Generally, the reply to the former question is visible on the long-term charts (and since the recent price change was so significant, it seems that only these charts have meaningful implications, so we will focus on them), and the latter question can be replied in the following way.
Firstly, there were 2 fundamental reasons:
- Yesterday, crude oil remained under pressure after the U.S. Energy Information Administration reported on Wednesday that U.S. crude oil supplies increased by 5 million barrels in the week ending October 3, beating expectations for a gain of 1.6 million barrels.
- Earlier today, crude oil futures extended losses after the Organization of the Petroleum Exporting Countries reported that September output hit the highest level in more than a year and Saudi Arabia signaled it had no plans to cut production, which fueled further worries that global supply is plentiful.
Secondly, there were 2 technical reasons:
- The general stock market declined recently and due to multiple industrial uses, crude oil quite often moves in tune with stocks. Since the general stock market has been declining and it seems quite close to reaching its bottom, we could expect the negative impact on crude oil to become a positive one.
- Additionally, the U.S. Department of Labor reported yesterday that the initial jobless claims in the week ending October 4 decreased by 1,000, beating analysts’ expectations for a 6,000 increase. These better-than-expected weekly U.S. claims numbers weakened the price of crude oil by strengthening the dollar.
What’s next? In our opinion, higher prices seem likely, even if they are not seen immediately. One of reasons for which crude oil is likely to move higher in the coming weeks is the situation in commodities in general (charts courtesy of http://stockcharts.com.)
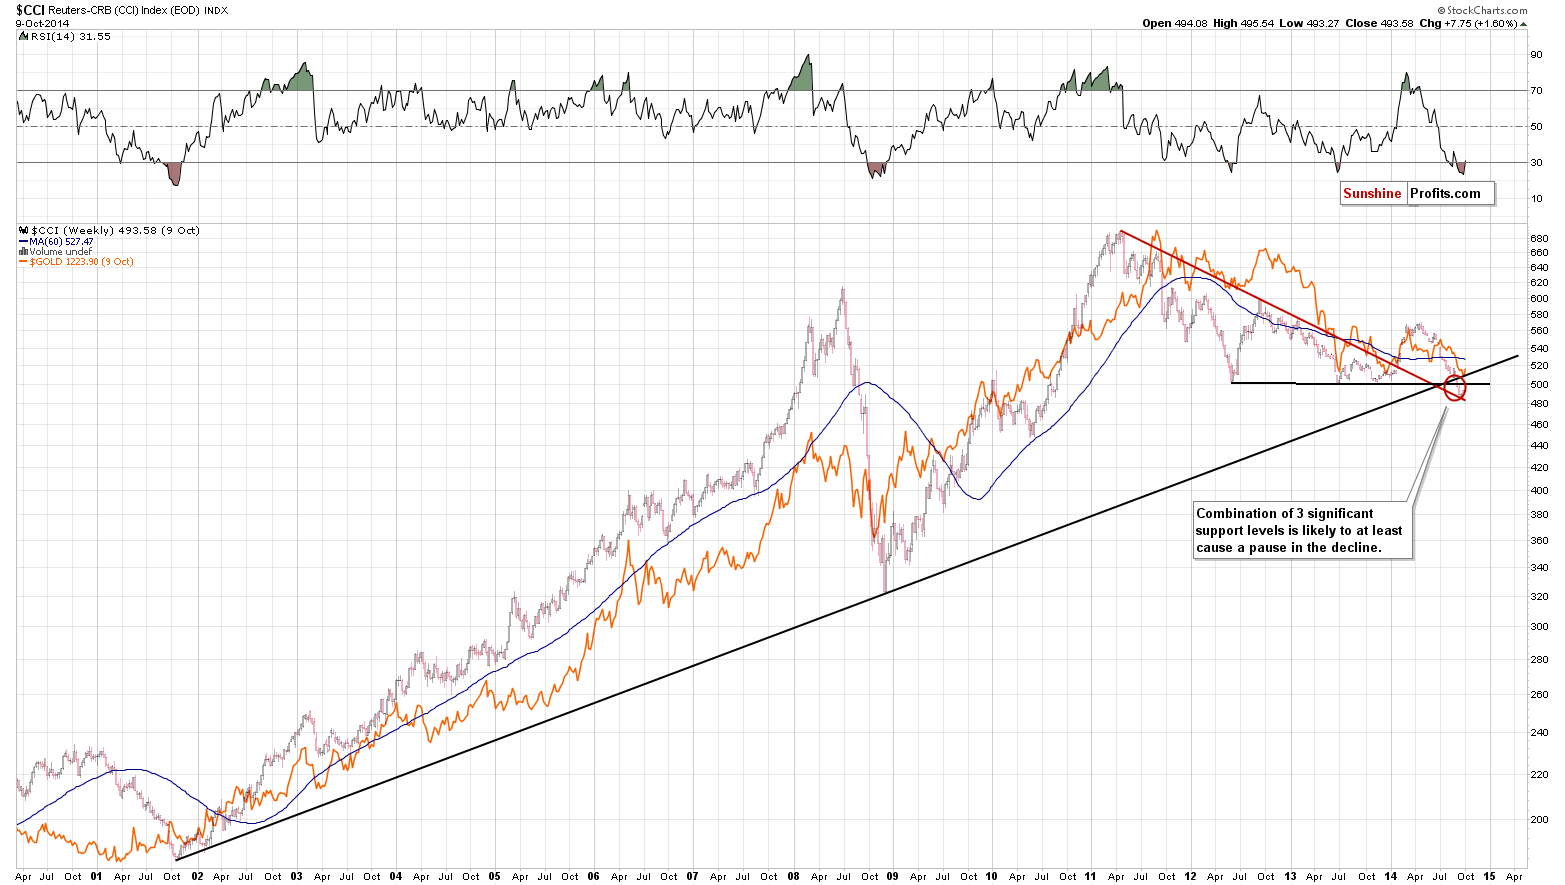
The CCI Index – proxy for the commodity sector seems to have bottomed in our target area (it moved to the declining red support line). The RSI indicator is below 30, which suggests that a bigger rally is just around the corner. If the entire sector is about to move higher, then it would be very unlikely for the most versatile of all commodities – crude oil – not to move higher.
The second technical reason comes from the analysis of the long-term crude oil chart.
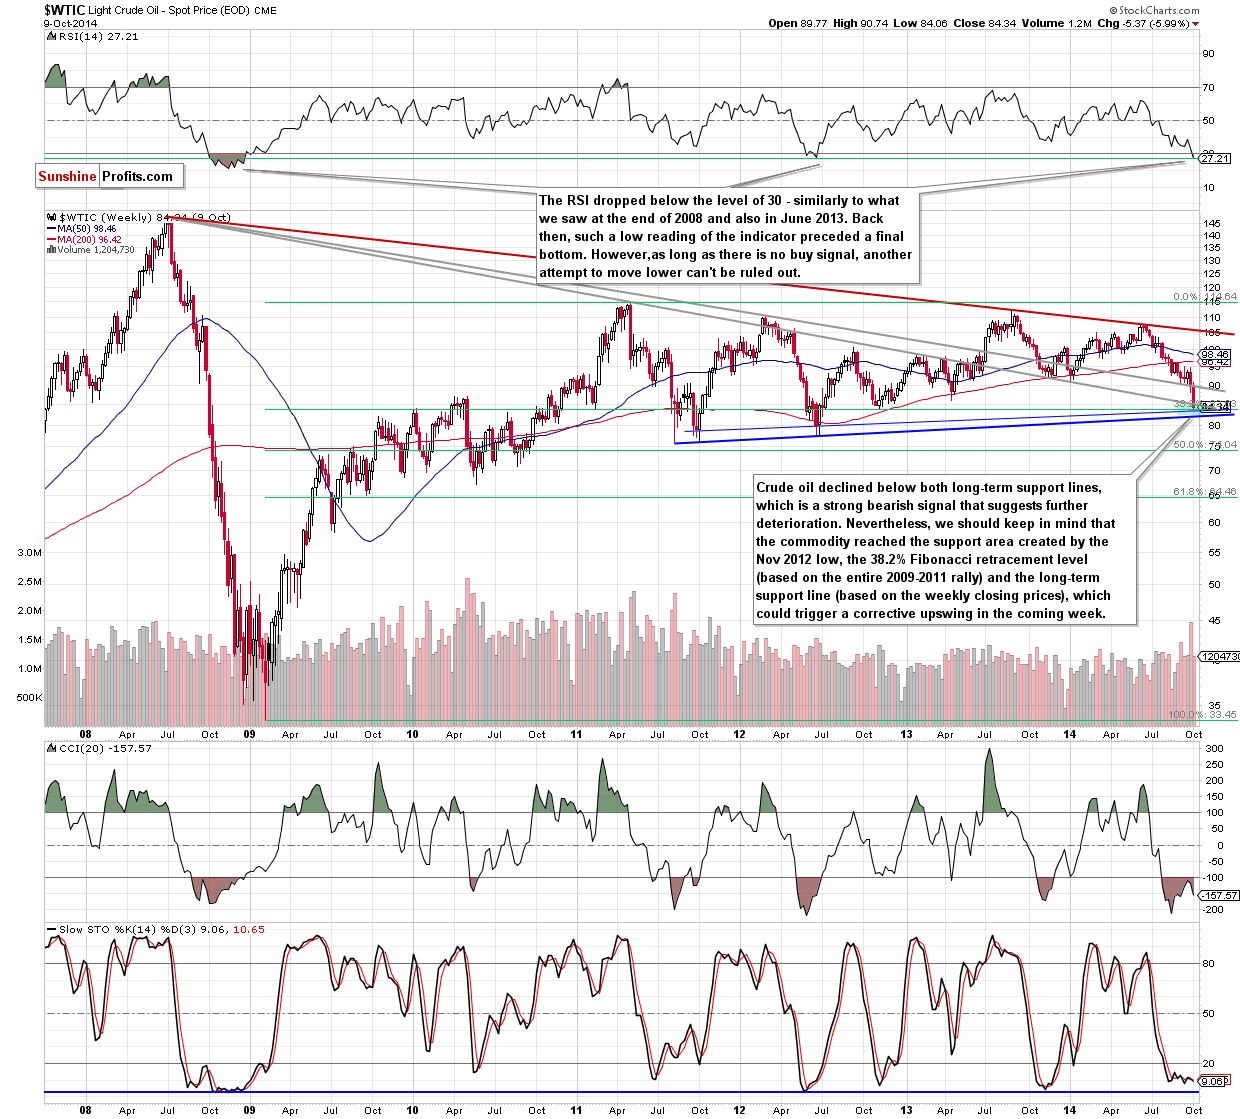
The most important event of the week was yesterday’s breakdown below both long-term support lines (marked with grey). Although this is a strong bearish signal that suggests further deterioration, we would like to draw your attention to the fact that crude oil reached the support area created by the combination of the Nov 2012 low, the 38.2% Fibonacci retracement level (based on the entire 2009-2011 rally) and the long-term blue support line (based on the weekly closing prices). Consequently, we could see a rebound from here in the coming week.
What’s interesting, at the same time, the RSI dropped below the level of 30. We saw similar readings of the indicators at the end of 2008 and also in June 2013. Back then such low readings of the indicator preceded a final bottom. However, as long as there is no buy signal (and an invalidation of the breakdown below the lower long-term support/resistance line), another attempt to move lower can’t be ruled out. In our opinion, even if we see such price action, the space for furthers declines would be limited by the long-term blue support line based on the Aug 2011, Oct 2011 and Jun 2012 lows (currently around $82.42).
Summing up, it seems that crude oil will move higher rather sooner than later and that the coming move will be rather significant (tradable). We are planning to re-enter the long position at lower prices or after seeing a confirmation that the final bottom is indeed in.
Very short-term outlook: bullish
Short-term outlook: mixed with bullish bias
MT outlook: mixed
LT outlook: bullish
Trading position (short-term): No positions.
Thank you.
Nadia Simmons
Forex & Oil Trading Strategist
Przemyslaw Radomski, CFA
Founder, Editor-in-chief
Gold & Silver Trading Alerts
Forex Trading Alerts
Oil Investment Updates
Oil Trading Alerts

