
On Thursday, crude oil lost 3.30% as Libya prepared to restart a major oilfield and on speculation of a rise in crude oil inventories in the United States. Additionally, U.S. jobless claims fell less-than-expected, which added selling pressure. Thanks to this negative combination of factors, light crude declined sharply and hit a monthly low of $95.34.
In our previous Oil Trading Alert, we wrote that expectations for Libyan oil exports to resume to near normal levels weighted on the price of light crude in recent days. Yesterday, oil investors received another piece of bearish news. Officials said that Libya hopes to resume production at one of its largest oilfields, El Sharara (which used to produce 350,000 barrels a day) in the west of the country, within three days after protesters agreed to suspend their two-month stoppage. Please note that a resumption of disrupted Libyan oil production could boost global supply and weigh on prices. However, oil ports in central and eastern Libya remain closed.
Also, yesterday the U.S. Department of Labor said that the number of individuals filing for initial jobless benefits declined by 2,000 to a seasonally adjusted 339,000 last week. Analysts had expected U.S. jobless claims to fall by 7,000 to 334,000 from the previous week’s revised total of 341,000. In our previous Oil Trading Alert, we wrote that investors shrugged off U.S. consumer confidence data. Although they were solid, they didn’t boost the commodity. Therefore, as you might’ve guessed, a smaller- than-expected drop in U.S. jobless claims weighted on the price of light crude adding selling pressure.
Oil investors now looked ahead to key U.S. weekly supply data, which was forecast to show a fifth consecutive weekly drop in crude stockpiles. However, there are speculations that the strong inventories decline that we had in recent weeks was very likely linked to tax management at year-end than true underlying strength in demand. If this is the case and we see an increase in crude oil inventories, oil bears will receive another important reason to push the sell button.
Having discussed the above, let’s move on to the technical changes in the crude oil market (charts courtesy of http://stockcharts.com).
Quoting our previous Oil Trading Alert:
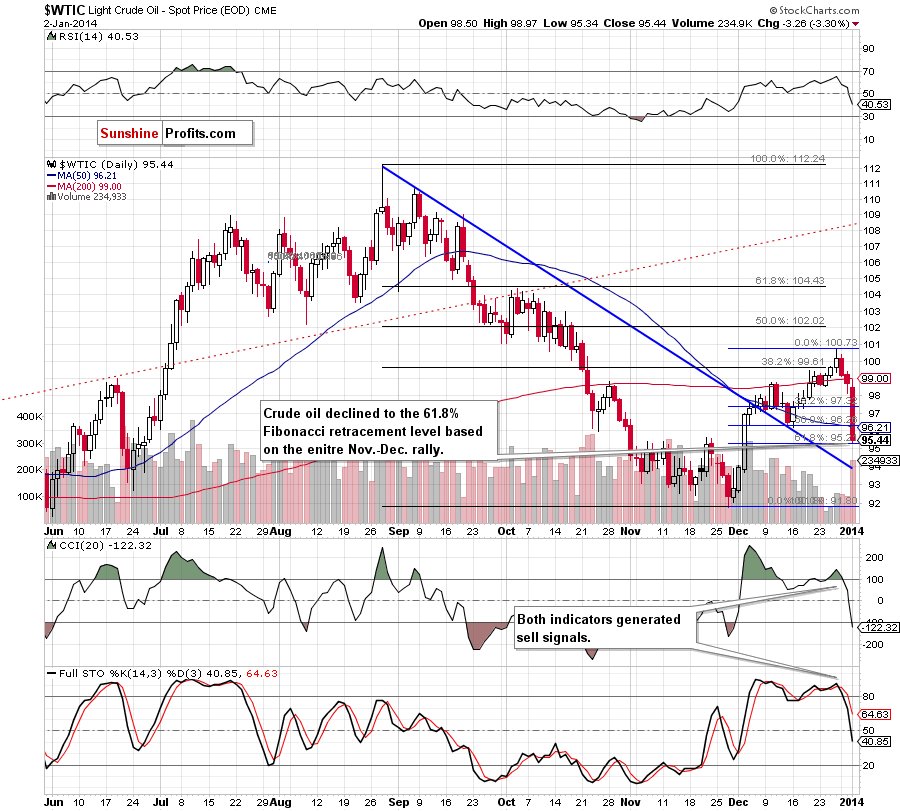
(…) although crude oil rebounded (...), it still remains below the 200-day moving average. Additionally, the CCI and Stochastic Oscillator generated sell signals, which is a bearish signal, therefore, further deterioration should not surprise us.
On the above chart, we clearly see that the situation has deteriorated significantly. Yesterday, after the market open, we saw an attempt to move above the previously-broken 200-day moving average. However, the buyers failed, which triggered a sharp decline. Oil bears not only pushed the price below the nearest support (the 38.2% Fibonacci retracement level based on the entire Nov. - Dec. rally), but also below the 50% retracement and almost reached the next Fibonacci retracement level. With this downward move, crude oil declined below the 50-day moving average, which is a bearish signal. On top of that, yesterday’s decline materialized on large volume, which confirms the strength of the sellers.
Looking at the daily chart, we should consider two scenarios. If the 61.8% Fibonacci retracement encourages oil bulls to act, we will likely see an upside correction that will take the price to at least $96.21, where the previously-broken 50-day moving average is. On the other hand, if the buyers fail and crude oil drops below this strong support level, we will likely see further deterioration and the next downside target will be around $94.08 where the Dec. 2 high intersects with the short-term declining support line (marked in blue).
Having discussed the current situation in crude oil, let’s take a look at WTI Crude Oil (the CFD).
Quoting our last Oil Trading Alert:
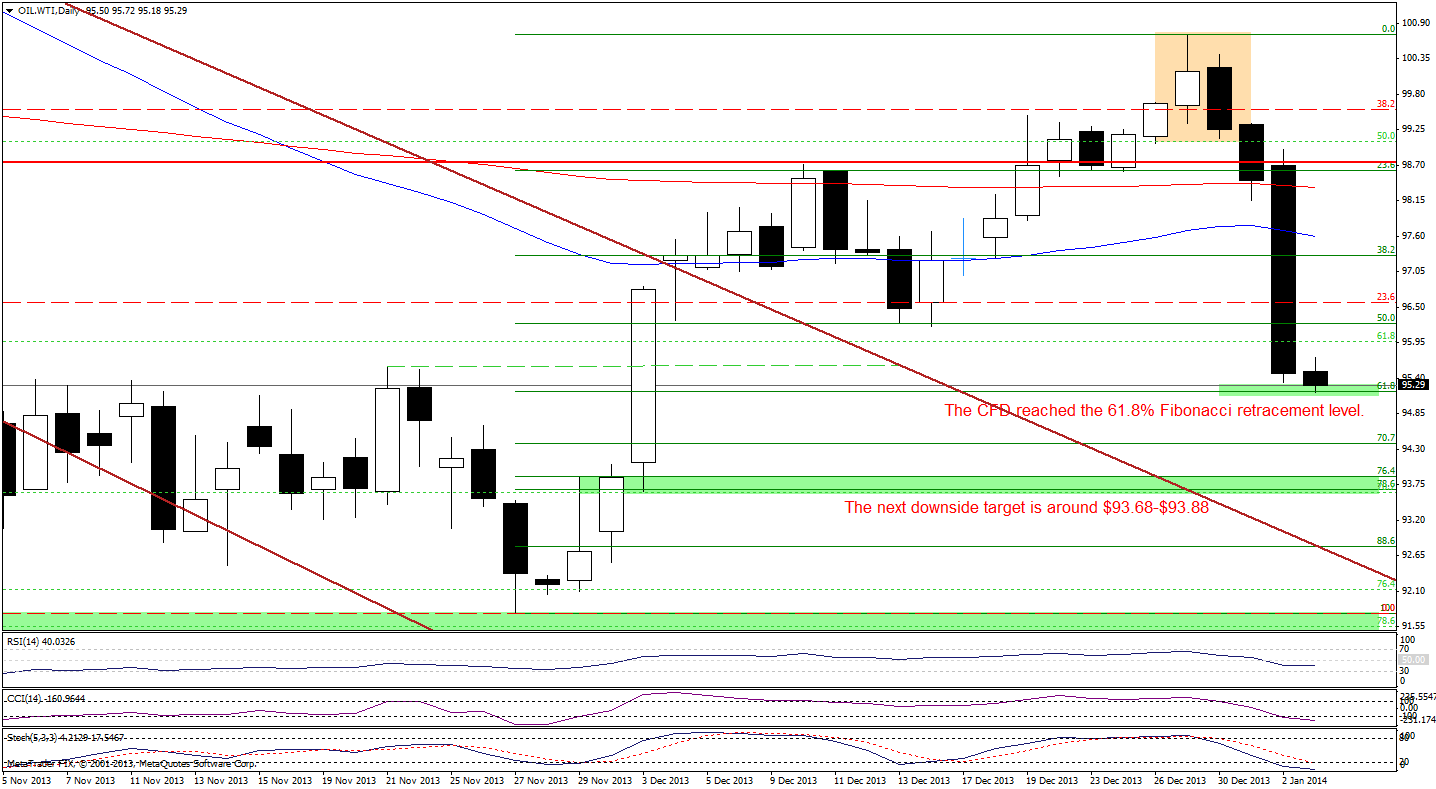
(…) if oil bears show their claws once again and the price drops below the Tuesday’s low, we will likely see further deterioration and a downward move to the next downside target - the 38.2% Fibonacci retracement level based on the entire Nov.-Dec. rally around $97.30.
As you see on the above chart, yesterday oil bears showed their claws and triggered a sharp decline, which not only pushed the CFD to the 38.2% Fibonacci retracement, but also much lower than this level. The sellers broke below the 50% Fibonacci retracement without a problem and reached the 61.8% Fibonacci retracement level earlier today.
At this point, similarly to what we wrote in the case of crude oil, we should consider two scenarios. If this strong support level encourages oil bulls to act, we will likely see an upside correction that will take the price to at least $96.20 where the Dec. 16 low is. On the other hand, if the buyers fail and the CFD drops below the 61.8% retracement, we will likely see further deterioration and the next downside target will be around $93.68-$93.88, where the Dec. 3 low intersects with the 78.6% Fibonacci retracement level. Nevertheless, we could see a pause in the current correction around $94.40.
Looking at the position of the indicators, we see that the RSI declined below the level of 40 and it still has some space for further drops. The CCI and Stochastic Oscillator are oversold, but they didn’t generate buy signals, which supports the bearish case.
Once we know the above, let’s take a look at the NYSE Arca Oil Index (XOI) chart.
Quoting our previous Oil Trading Alert:
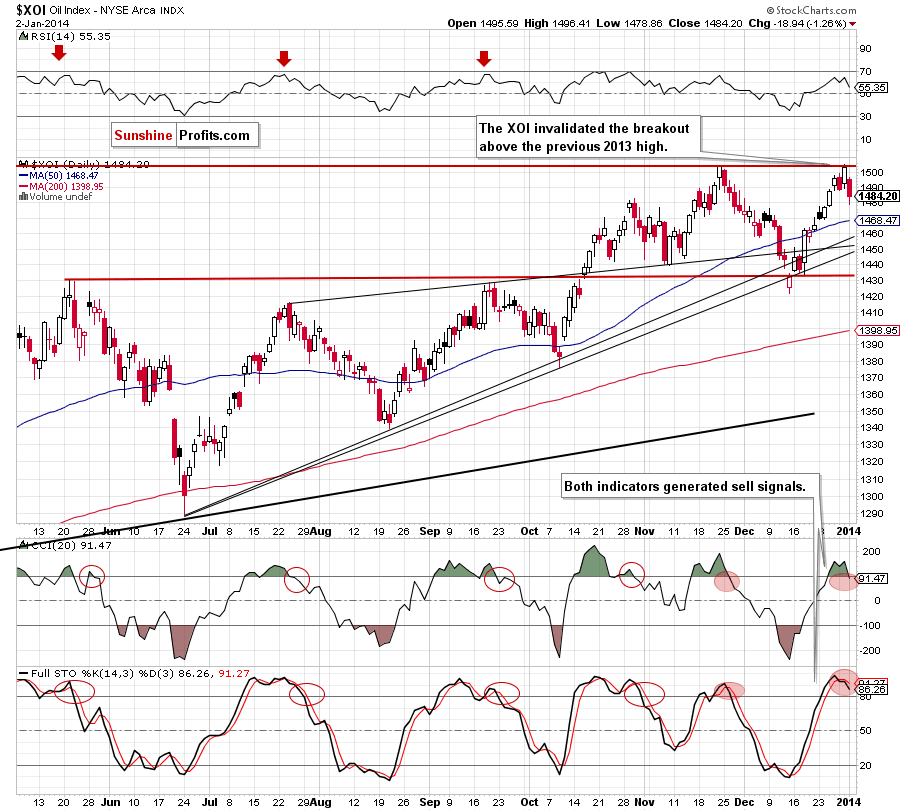
(...) we should keep in mind that the CCI and Stochastic Oscillator are overbought and the latter generated a sell signal, which may encourage sellers to act. (...) the oil stock index almost reached the upper line of the rising wedge, which successfully stopped further growth in 2013. If history repeats itself once again, we may see similar price action to the one we saw in the previous year. On the other hand, if this line is broken, we will likely see another upswing to the blue medium-term rising resistance line, which stopped an upward move in November 2013.
Looking at the above chart, we see that the buyers didn’t manage to push the XOI above the major medium-term resistance line, which resulted in a decline. As you see on the above chart, yesterday the oil stock index gave up the gains, reversed course and dropped below 1,490. With this downward move, the XOI invalidated small (actually a very small) breakout above the previous 2013 high, which is a bearish signal. On top of that, the CCI also generated a sell signal.
From this perspective, an invalidation of the breakout in combination with the proximity to medium-term resistance line and sell signals generated by two indicators will likely result in further deterioration in the coming days.
Summing up, yesterday the short-term outlook for crude oil turned to bearish as light crude declined heavy and dropped below the 50% Fibonacci retracement level and the 50-day moving average. As mentioned earlier, with this downward move crude oil almost touched the next Fibonacci retracement, therefore we could see a pause in the current correction. However, if the price drops again, the next target for the sellers will be the short-term declining support line, which successfully stopped declines in December. Please note that signals generated by two indicators still support the bearish case.
Very short-term outlook: bearish
Short-term outlook: bearish
MT outlook: bullish
LT outlook: mixed
Trading position (short-term): We do not suggest opening any positions at the moment. We will keep you informed should anything change, or should we see a confirmation/invalidation of the above.
Thank you.
Nadia Simmons
Forex & Oil Trading Strategist
Oil Investment Updates
Oil Trading Alerts

