
On Thursday, crude oil lost 0.63% after stronger-than-expected U.S. economic growth and a surprise interest rate cut by the European Central Bank pushed the dollar up. U.S. third-quarter growth data also boosted speculation the Federal Reserve could begin to taper its stimulus program sooner than expected.
The European Central Bank’s move to cut interest rates to a record low boosted the dollar, making dollar-denominated crude more expensive for buyers outside the United States. Additionally, stronger-than-expected U.S. economic data supported the greenback. Official data showed that the American economy grew in the third quarter at the quickest pace in a year. The U.S. economy grew at an annual rate of 2.8% in the three months to September, well above expectations for growth of 2%. Positive data added to ongoing speculation that the Fed may start tapering its stimulus program at its December meeting.
Keep in mind that the Fed’s stimulus program is viewed as a key driver in boosting the price of commodities as it tends to depress the value of the dollar. Therefore, a cutback in stimulus by the Fed later this year would reduce the supply of dollars and make dollar-denominated assets such as oil more expensive for holders of other currencies.
Today, oil investors are looking ahead to U.S. nonfarm payroll data. Economists polled by Reuters expect 125,000 jobs to have been added in October. However, last month's 16-day U.S. government shutdown may affect the figures.
Having discussed major factors which may have recently influenced the price of light crude, let’s move on to the technical changes in the crude oil market (charts courtesy of http://stockcharts.com).
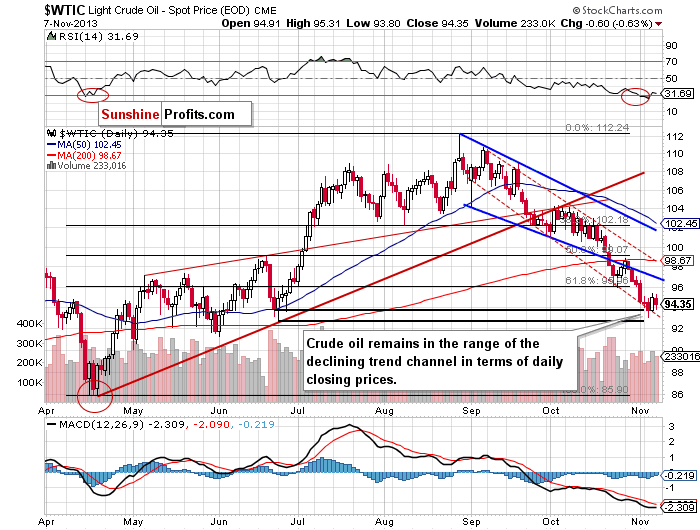
Yesterday, after the market’s open light crude climbed to its daily high of $95.31, but oil bulls didn’t manage to push the price above Wednesday’s top. These circumstances encouraged sellers to trigger a downswing, which took crude oil below $94. However, this deterioration was temporary and the price came back above this level in the following hours. In spite of this drop, crude oil still remains in the range of the declining trend channel in terms of daily closing prices (marked with the red dashed line).
Please note that the lower border of this channel (currently around $93) and the bottom of the corrective move that we saw in June (in terms of daily closing prices) still serve as support.
Once we know the current situation in crude oil, let’s move on to the XOI daily chart.
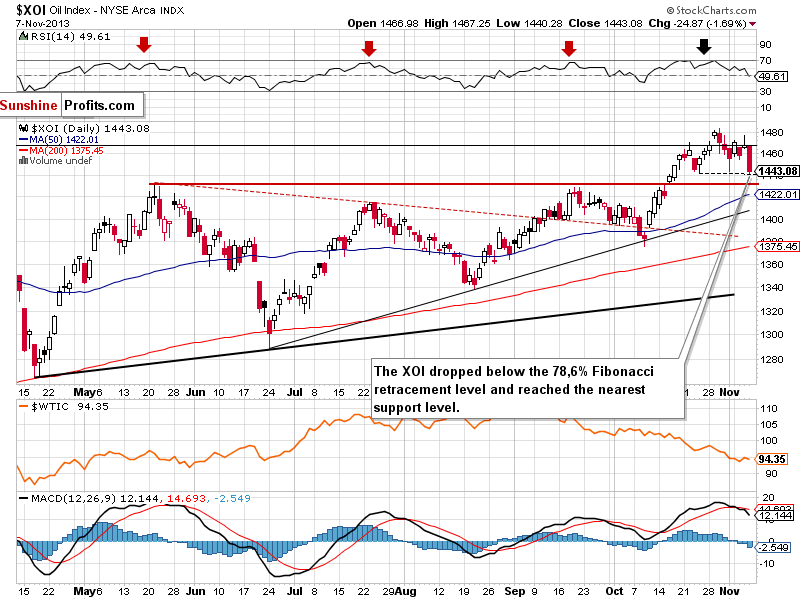
Yesterday, after the open, the oil stocks index bounced off the 78.6% Fibonacci retracement level (close to 1,467), which resulted in a heavy decline. With this downward move, the XOI dropped to its daily low at 1,440 and reached the bottom of the recent corrective move.
If this support level encourages buyers to act, we may see a pullback – similarly to what we saw in the previous week. However, when we take a closer look at the above chart, we can see a head and shoulders formation. In this case, if the neck level is broken, we will likely see further declines. According to theory, the price target for this bearish pattern is around 1,400.
There’s also another bearish factor for the XOI Index – its tight link to the general stock market, and the outlook for the latter. Stocks have recently been moving in tune with their True Seasonal patterns and if this tendency continues (and the XOI-stocks link remains in place), then we can expect both the general stock market and oil stocks to decline in the coming weeks.
Summing up, in spite of Thursday’s drop, the situation hasn’t changed much. Crude oil remains in the range of the declining trend channel in terms of daily closing prices. The lower border of this channel and the bottom of the corrective move that we saw in June (in terms of daily closing prices) still serve as support. As we wrote in our previous Oil Trading Alert, it’s too early to assume that the final bottom of the recent corrective move is already in.
Very short-term outlook: bearish
Short-term outlook: bearish
MT outlook: bearish
LT outlook: unclear
Trading position (short-term): Taking into account the medium- and short-term picture, we do not suggest opening any positions yet.
Thank you.
Nadia Simmons
Sunshine Profits' Crude Oil Expert
Oil Investment Updates
Oil Trading Alerts

