
On Monday, crude oil lost 0.63% as traders cashed in profits following six sessions of strong gains. Although light crude dropped below $98, it still remains near a five-week high.
Although investors didn’t receive important economic data from the US, Chinese data are worth a mention. As we wrote in our today’s Oil Investment Update:
(…) investors should also keep an eye on Chinese economic data because China is the world's second largest oil consumer after the U.S. and has been the engine of strengthening demand in recent week.
On Sunday, official data showed that China’s trade surplus widened unexpectedly in November as exports rose more than expected, easing concerns over global growth prospects. China’s trade surplus widened to $33.8 billion last month from a surplus of $31.1 billion in October, compared to estimates for a surplus of $21.7 billion. Chinese exports climbed 12.7% from a year earlier, beating expectations for a 7.1% increase and following a 5.6% gain in October. Imports rose 5.3%, missing forecasts for a 7.2% increase.
On Monday, a government report showed that consumer price inflation in China rose 3% in November, in line with expectations and slowing from 3.2% in October. This week, market players looked ahead to a raft of Chinese economic data including reports on inflation, industrial production and retail sales.
Having discussed the above, let’s move on to the technical changes in the crude oil market (charts courtesy of http://stockcharts.com).
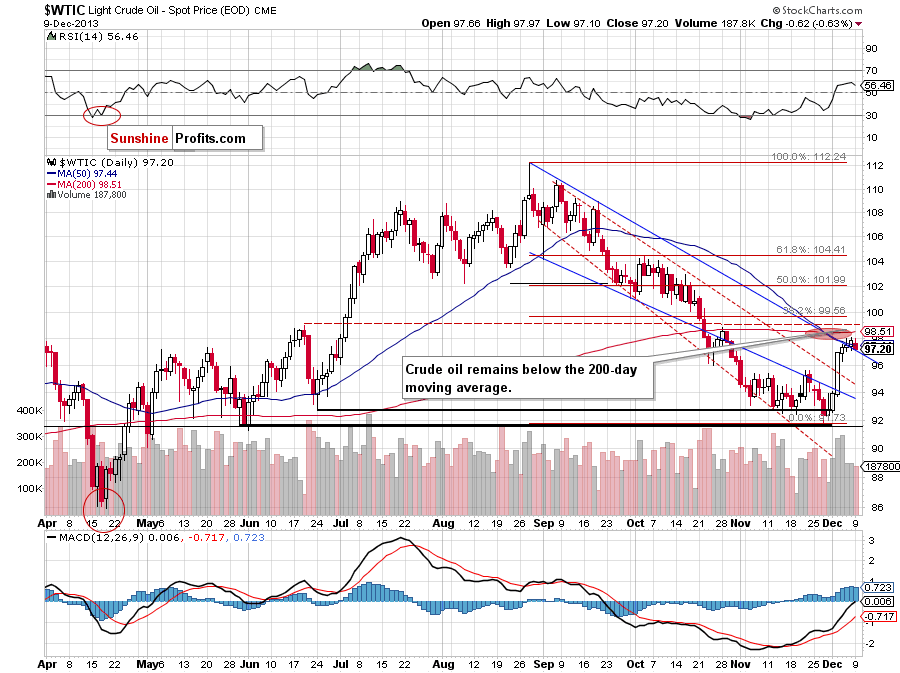
Looking at the above chart, we see that yesterday the proximity to the 200-day moving average encouraged oil bears to act and resulted in a decline to the previously-broken upper border of the declining trend channel (in terms of intraday highs). Please note that despite this drop, the breakout above this line was not invalidated and it still serves as support. If it’s broken, the next support will be around $95.30. However, if oil bulls manage to push the price higher, the first target will be the 38.2% Fibonacci retracement level around $99.55.
Having discussed the current situation in crude oil, let’s take a look at WTI Crude Oil (the CFD).
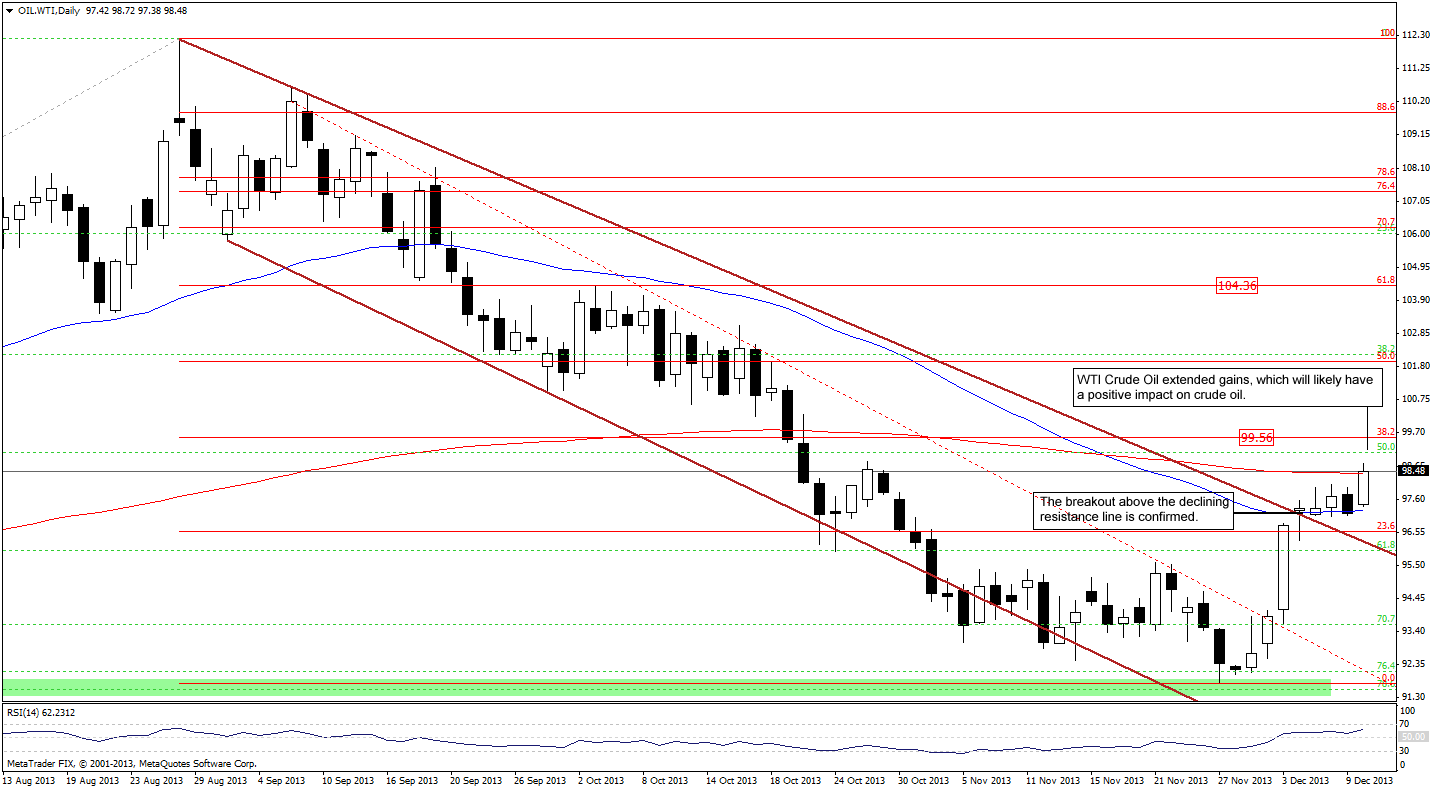
Looking at the above chart, it seems that WTI Crude Oil is a step ahead of crude oil. As you can see on the daily chart, the breakout above the upper line of the declining trend channel (in terms of daily closing prices) took place on Dec. 2. We saw similar price action in the case of crude oil only on the next day. Additionally, on Dec. 4 WTI Crude Oil broke above the upper border of the declining trend channel (in terms of intraday highs). What happened with light crude at the same? It was still trading below this resistance line. Taking the above into account, we can conclude that if we see further improvement in WTI Crude Oil, we will likely see similar price action in crude oil in the following days.
The nearest support is created by the previously-broken upper line of the declining trend channel and reinforced by the 23.6% Fibonacci retracement level. The first upside target is the 38.2% Fibonacci retracement level around $99.55.
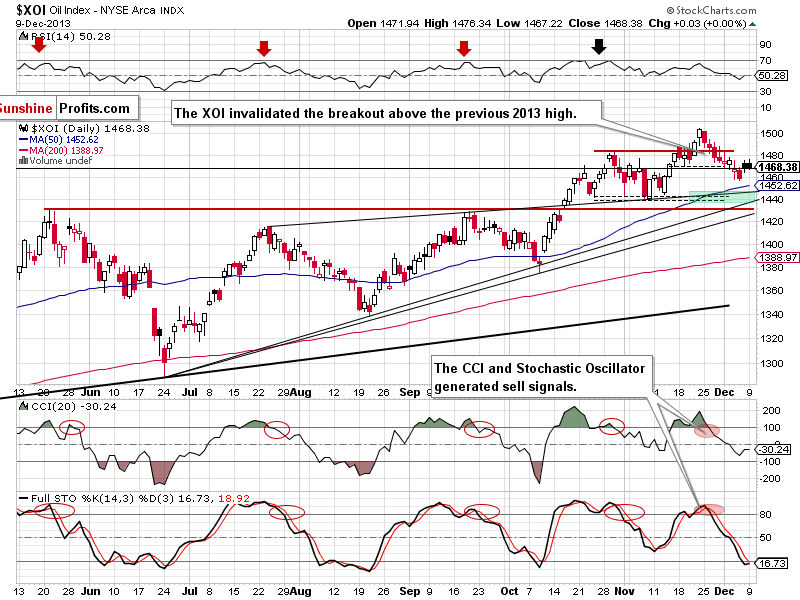
Once we know the above, let’s take a look at the NYSE Arca Oil Index (XOI) weekly chart.
Quoting our yesterday’s Oil Trading Alert:
(…) If the XOI moves above 1,475, we may see further improvement and an attempt to move above 1,483 (the previous 2013 top). On the other hand, if oil stocks drop below 1,457, we will likely see further deterioration. In this case, the first downside target will be the 50-day moving average (currently at 1,450). If it’s broken, we may see a downward move to a support zone created by the upper line of the rising wedge (marked with the thin black line) and the bottom of the correction that we saw at the beginning of November (around 1,440-1,446).
Looking at the above chart, we see that the XOI rose to its intraday high at 1,476 on Monday and broke above the upper line of the consolidation range. However, the breakout was quickly invalidated and oil stocks came back to the consolidation range. Taking this fact into account, what we wrote in our Monday’s Oil Trading alert remains up-to-date.
Summing up, after an upswing to the 200-day moving average, crude oil declined, but it still remains above the previously-broken upper line of the declining trend channel. If this support is broken, we may see further deterioration, however, based on the size of last week's rally and the accompanying volume, it seems that a downswing will be just a pause / pullback, not another big move lower.
Very short-term outlook: bullish
Short-term outlook: bullish
MT outlook: mixed with bullish bias
LT outlook: mixed
Trading position (short-term): Long. Stop-loss order for this position: $91.55. Stop-loss order for WTI Crude Oil: $91.30. We will keep you informed should anything change, or should we see a confirmation/invalidation of the above.
Thank you.
Nadia Simmons
Sunshine Profits' Crude Oil Expert
Oil Investment Updates
Oil Trading Alerts

