
On Friday, crude oil lost 1.09% as rising concerns over whether the U.S. Federal Reserve may begin to withdraw its stimulus program weighted on price. In this way, light crude closed the previous week below $97 per barrel.
On Friday, the Labor Department reported that the U.S. producer price index fell 0.1% last month, after a 0.2% decline in October. Core producer price inflation, which excludes food and energy, rose 0.1% in November after a 0.2% increase the previous month. Although the above data were in line with expectations, it was enough to fuel concerns amid investors that the Federal Reserve could make a small cut to its asset purchase program at its upcoming policy meeting and push the price of light crude lower.
Please note that the Fed meets on Tuesday and Wednesday to discuss the tapering and opinion is divided on whether it will move this week or wait for early next year. As a reminder, a cut in its stimulus would boost the dollar, weighing on most commodities, including oil, that are priced in the currency. Therefore, the U.S. Federal Reserve's decision on tapering its monetary stimulus, will be the most important factor that will affect the price this week.
Having discussed the above, let’s move on to the technical changes in the crude oil market (charts courtesy of http://stockcharts.com).
Quoting our last Oil Trading Alert:
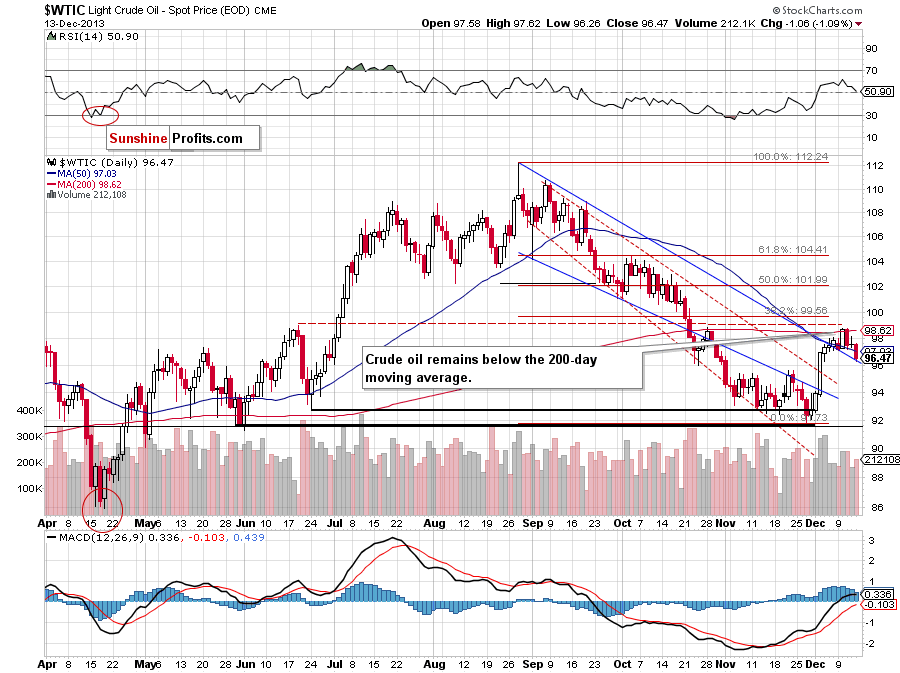
(…) recent days have formed a consolidation. According to theory, if we see a breakout above $98.75, we will likely see further improvement and an upward move to around $100. However, if oil bears show their claws once again and take the price below $97.20, the downside price target will be around $95.65, which corresponds to the previously broken resistance level created by the Nov. 21 high. Please note that before the sellers realize their scenario, they will have to push crude oil below the upper line of the declining trend channel – currently around $96.40.
Looking at the above chart, we see that oil bears pushed crude oil below its 50-day moving average on Friday, which triggered a downward move below $97.20. Although the sellers tried to realize their scenario, the upper line of the declining trend channel stopped further declines. At this point, we should consider two scenarios. If this support line encourages oil bulls, we will likely see an upswing to at least $98.18. On the other hand, if the buyers fail, we will likely see further deterioration and the downside price target will be around $95.65.
Having discussed the current situation in crude oil, let’s take a look at WTI Crude Oil (the CFD).
Quoting our previous Oil Trading Alert:
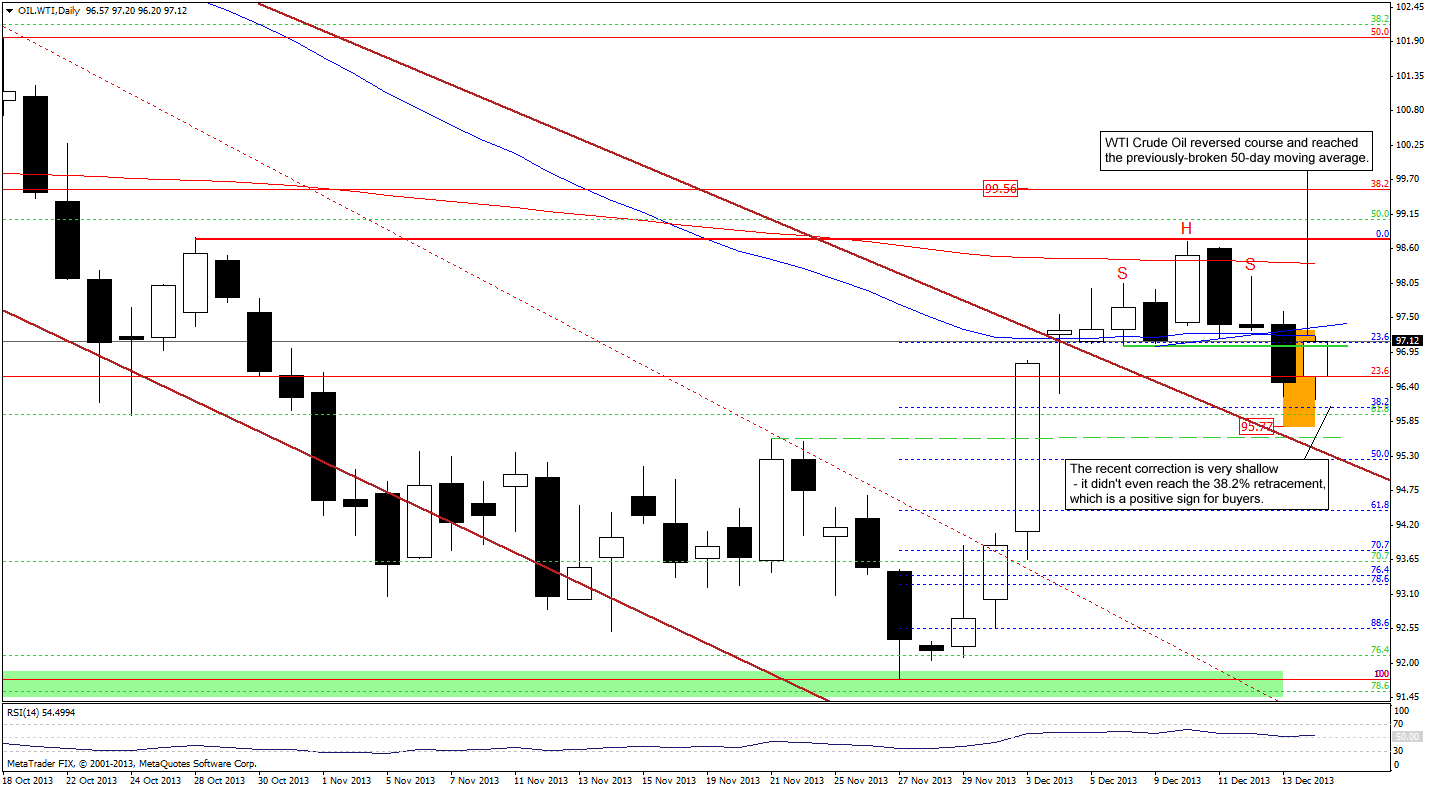
(…) the CFD slipped below the 50-day moving average (…), which will likely trigger a downswing to its first downside target around $96 where the 38.2% Fibonacci retracement (based on the entire recent rally) is.
Although WTI Crude Oil moved lower, we clearly see on the above chart that the CFD turned positive before reaching this downside target, which is a bullish signal. With this upswing, the price reached the previously-broken 50-day moving average and invalidated the breakdown below a support zone based on the Dec. 6 and Dec. 9 lows.
If we see further improvement and the CFD invalidates the breakdown below the neck line (marked in blue), we will likely see an upward move to at least $98.16.
Please note that our last week’s assumption remains up to date: “(…) taking into account the fact that crude oil and WTI Crude Oil move together in the same direction, it seems that a move in the CFD will trigger a similar move in light crude.”
Once we know the above, let’s take a look at the NYSE Arca Oil Index (XOI) weekly chart.
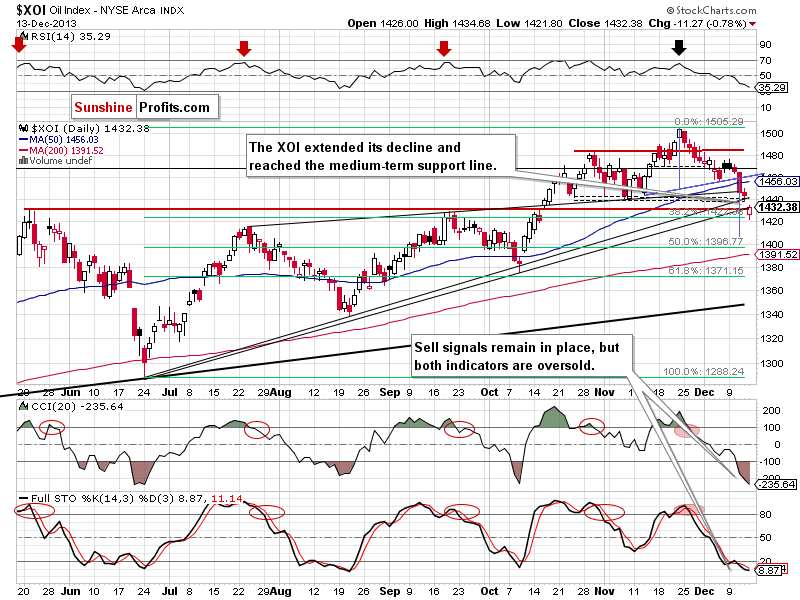
Looking at the above chart, we see that the situation deteriorated significantly on Friday. The XOI extended its decline and dropped below the medium-term rising support line based on the June and August lows. Although this line successfully stopped further declines in early October, this time it failed and the oil stock index moved lower. With this downward move, the XOI also broke below the nearest major support zone created by the May high and the lower medium-term support line based on the June and October lows.
However, when we take a closer look at the chart, we see that the XOI reversed course after reaching the 38.2% Fibonacci retracement level based on the entire June-November rally. Although this support encouraged buyers to act, they didn’t manage to push the index above the previously-broken medium-term rising support line and the XOI closed the day below it.
Please note that even if the buyers do not give up and the oil stock index comes back above this line, it will have to break above the medium-term rising support line based on the June and August lows and the upper line of the rising wedge before we see a bigger upward corrective move.
Taking into account Friday’s deterioration, we should keep in mind what we wrote in our Oil Trading Alert on Thursday:
(…) when we take a closer look at the chart, we can notice a head and shoulders pattern. The yesterday drop pushed the XOI below the neck line (marked with blue), which may trigger further deterioration. According to theory, the price target for this formation will be around 1,410. Nevertheless, before the sellers realize their scenario, they will have to push the oil stock index below the support zone.
Summing up, after the breakdown below the 50-day moving average, crude oil broke below the lower line of the consolidation range and reached the upper line of the declining trend channel, which successfully stopped further decline on Friday. If this support holds, we will likely see an upswing above $98. Keep in mind that the current corrective move is still shallow and it hasn’t even reached the 38.2% Fibonacci retracement level based on the recent rally. Consequently, the situation remains bullish.
Very short-term outlook: bullish
Short-term outlook: bullish
MT outlook: mixed with bullish bias
LT outlook: mixed
Trading position (short-term): Long. Stop-loss order for this position: $91.55. Stop-loss order for WTI Crude Oil (CFD): $91.30. We will keep you informed should anything change, or should we see a confirmation/invalidation of the above.
Thank you.
Nadia Simmons
Sunshine Profits' Crude Oil Expert
Oil Investment Updates
Oil Trading Alerts

