
On Tuesday, crude oil lost 0.81% and dropped below $98 once again as disappointing U.S. economic data fueled concerns over weaker demand in the world's biggest oil consumer. Additionally, data from American Petroleum Institute showed that U.S. crude oil stocks rose by 5.9 million barrels last week while stockpiles at Cushing increased by 2.2 million barrels.
Although core retail sales, which exclude automobile sales, and core inflation edged up in line with expectations, U.S. retail sales fell 0.1% in September, compared to expectations for a 0.1% increase. A separate report showed that U.S. producer price inflation ticked down 0.1% in September, missing forecasts for a 0.2% increase.
Later in the day, the Conference Board said its index of consumer confidence dropped to 71.2 in October from an upwardly revised reading of 80.2 in September, as concerns over the U.S. government shutdown and the debt ceiling crisis weighed.
The above data reinforced expectations that the Fed will maintain its stimulus program well into the first quarter of next year, in order to safeguard the faltering economic recovery. Therefore, today investors are focusing on a comment from the U.S. Federal Reserve's two-day policy-making meeting.
Please note that the U.S. Energy Information Administration will also release its oil data today, which may have a great impact on the crude oil’s price moves, just like in the previous week.
Having discussed major factors which had an impact on the price of crude oil, let’s move on to the technical changes in the crude oil market (charts courtesy of http://stockcharts.com).
Quoting our previous Oil Trading Alert:
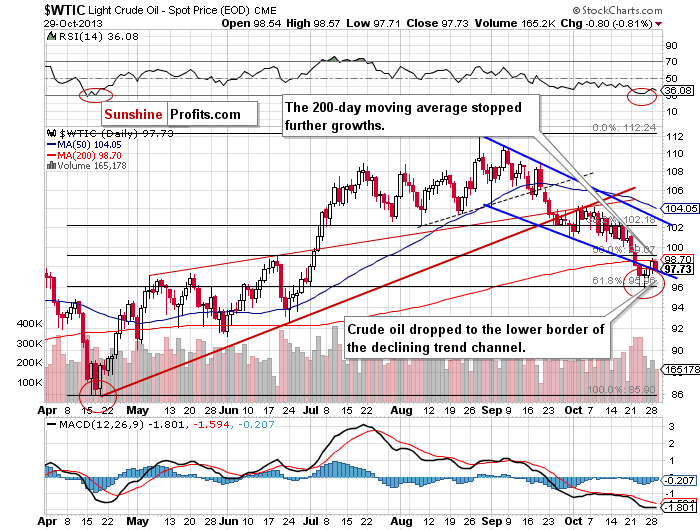
(...) the price came back in the range of the declining trend channel (...) However, as long as crude oil remains below the 200-day moving average it seems that further increases are limited. (…) Taking the above into account we should consider two scenarios. If oil bulls do not give up and (…) break above the 200-day moving average we will likely see further growth to around $101 per barrel. On the other hand, if the buyers show their weakness oil bears will likely trigger another corrective move and test the October low.
Looking at the above chart we clearly see that oil bulls didn’t have enough strength to push the price above the 200-day moving average. Therefore, sellers quickly noticed the opportunity to take profits after earlier increases. In this way, crude oil declined and reached the lower border of the declining trend channel. If the price of light crude drops below this line, we will see further deterioration and oil bears will likely test the October low.
In spite of this decline, crude oil still remains above a strong support zone based on the 50-week moving average, the previously-broken neck level of the reverse head and shoulders formation and the 61.8% Fibonacci retracement level based on the entire April-August rally.
Before we summarize, let’s move on to the XOI daily chart.
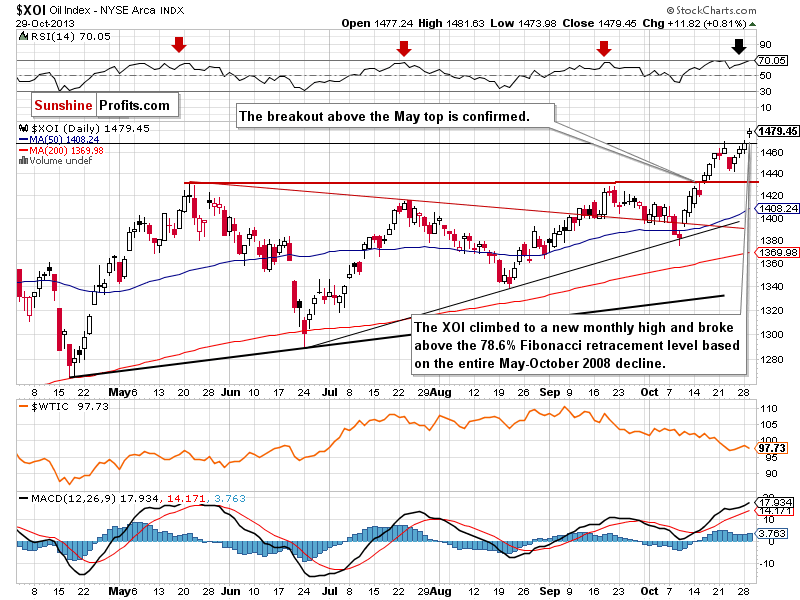
Yesterday, the oil stock index continued its rally and hit a fresh monthly high at 1,481. With this growth, oil stocks broke above the 78.6% Fibonacci retracement level (close to 1,467) based on the entire May-October 2008 decline and closed the day above it, which is a strong bullish sign. If the breakout above this strong resistance is confirmed and the buyers push the XOI higher, we may see a further increase to the psychological barrier of 1,500. If this resistance level is broken, the next target level will be around 1,560.
Quoting our previous Oil Trading Alert:
(…) we should keep in mind that the RSI almost reached the 70 level (…) therefore, we may see a corrective move in the near future. Please note that we saw similar price action several times in the previous months (marked with red arrows on the above chart).
Looking at the daily chart we can see a gap between Monday’s high and yesterday’s open (1,471-1,473.98), which serves now as support. The next support level is the bottom of the recent corrective move at 1,441. A further one lies at 1,428-1,430 and it is based on the May and September highs.
Summing up, the price of light crude bounced off the 200-day moving average and reached the lower border of the declining trend channel. If it drops below it, further declines should not surprise us. In this case, the first target for the sellers will be the October low.
Very short-term outlook: mixed
Short-term outlook: bearish
MT outlook: mixed
LT outlook: bullish
Trading position (short-term): we do not suggest opening any positions yet. Taking into account the very short-term picture, the situation is still unclear.
Thank you.
Nadia Simmons
Sunshine Profits' Crude Oil Expert
Oil Investment Updates
Oil Trading Alerts

