
On Wednesday, crude oil rose to a fresh five-week high for a fourth straight session of gains after the EIA data showed that refiners boosted operations sharply last week, reducing inventories for the first time since mid-September.
Although the Energy Information Administration said in its weekly report that crude oil stocks fell by 5.6 million barrels last week, it was far less than 12.4-million-barrel drop reported late Tuesday by the American Petroleum Institute. This news pushed crude oil to its intraday low of $96.30, however, light crude reversed the course and climbed in the following hours above $97 per barrel.
The drop in crude oil inventories was the largest weekly decline reported by the EIA since mid-July and followed a 10%, or 35.8-million-barrel, rise in the prior 10 weeks. Still, crude stocks on Nov. 29 stood at the highest end-November level recorded by EIA since 1930.
The EIA also said that refiners used 92.4% of capacity in the week ended Nov. 29, up 3 percentage points from a week earlier. Crude oil runs rose 3.6%, or 555,000 barrels a day, to 16.1 million barrels a day, the most since Sept. 13.
Having discussed the above, let’s move on to the technical changes in the crude oil market (charts courtesy of http://stockcharts.com).
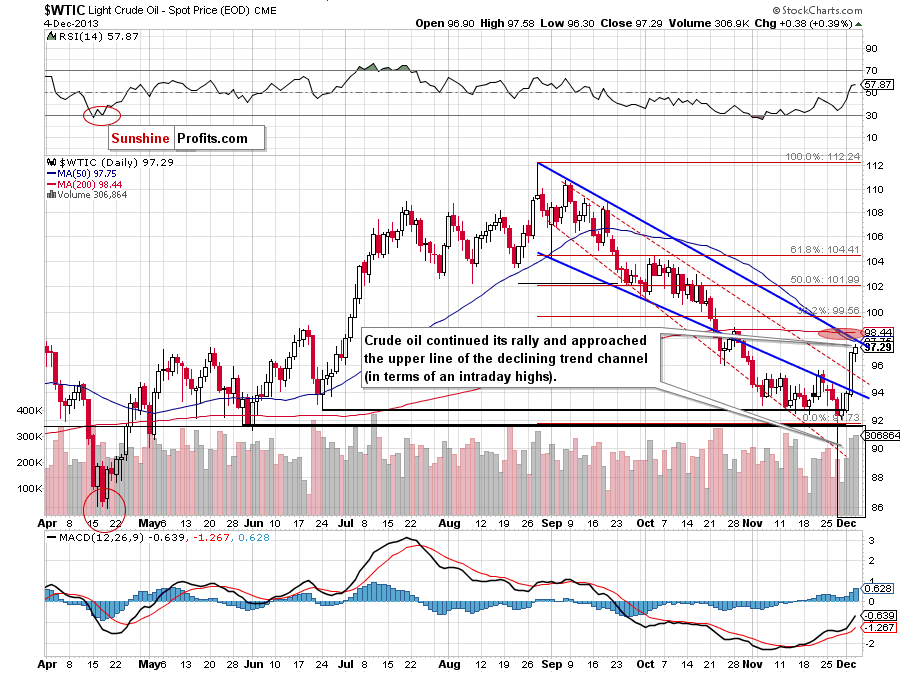
Looking at the above chart, we see that crude oil continued its rally during Wednesday’s session and almost reached the upper border of the declining trend channel. Please note that in this area is the 50-day moving average, therefore, a small pause after a four-day rally should not surprise us. Yesterday’s increase materialized on very high volume, which confirms the strength of the buyers.
If this resistance level is broken, the next target for oil bulls will be the 38.2% Fibonacci retracement level around $99.55. The nearest support is the previously-broken upper line of the declining trend channel in terms of daily closing prices.
Once we know the current situation in crude oil, let’s take a look at the NYSE Arca Oil Index (XOI) weekly chart.
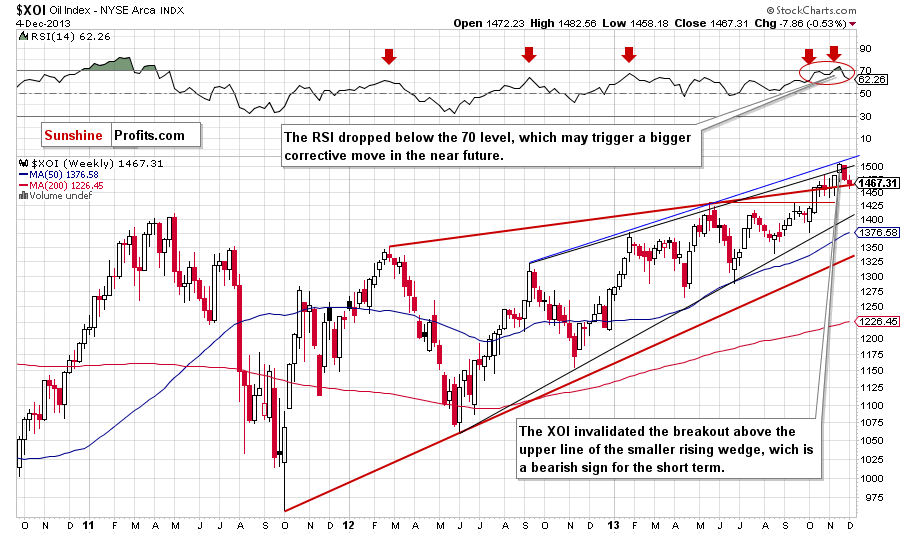
Looking at the above chart, we see that the situation has deteriorated slightly. Although the XOI extended its decline and dropped to its intraday low at 1,458, it still remains above the upper line of the rising wedge. Therefore, as long as this support is not broken, the space for further declines seems limited. However, if this support line is broken and the XOI confirms a breakdown below 1,470, we will likely see further deterioration. In this case, the downside target will be around 1,445 where the upper line of the rising wedge intersects with the 50-day moving average and the bottom of the correction that we saw at the beginning of November.
Summing up, crude oil increased once again on high volume, which confirms the strength of the buyers, and almost reached its first resistance. A pause in the near future should not surprise us.
Very short-term outlook: bullish
Short-term outlook: bullish
MT outlook: mixed with bullish bias
LT outlook: mixed
Trading position (short-term): Long. Stop-loss order for this position: $91.55. We will keep you informed should anything change, or should we see a confirmation/invalidation of the above.
Thank you.
Nadia Simmons
Sunshine Profits' Crude Oil Expert
Oil Investment Updates
Oil Trading Alerts

