
On Tuesday, crude oil rose to a five-week high for a third straight session of gains on news that a new pipeline would begin carrying crude oil to Texas refineries next month, helping reduce domestic crude stockpiles. The speculation that the EIA weekly data will show the first drop in U.S. inventories since September fueled the price also fueled the price of light crude.
According to TransCanada's filing with the Federal Energy Regulatory Commission, TransCanada Corp.'s Keystone Gulf Coast Pipeline will start carrying oil from Cushing, Okla., to Port Arthur, Texas, on Jan. 3. As a reminder, TransCanada had said in October that the 700,000-barrel-a-day pipeline was nearly finished but hadn't given a specific start date. Since then crude-oil supplies in Cushing have risen to their highest since July. Additionally, production in the U.S. has soared to near 20-year highs due mainly to hydraulic fracturing and horizontal drilling techniques, which have enabled energy producers to extract supplies trapped in shale-oil fields. At the same time, the infrastructure to carry the crude to the refineries in the Gulf Coast has been limited, allowing supplies to build up in Cushing and keeping U.S. oil prices low.
Taking the above news into account, it seems that supplies in Cushing, Oklahoma, will likely start to decline and boost U.S. oil prices. On top of that, the price may find one more bullish fundamental factor.
As we wrote in our last Oil Investment Update:
(…) as is well known, more refineries come back from seasonal maintenance. Therefore, crude stockpiles could begin falling and product stockpiles could grow. If this happens (maybe not this week, but likely this month), the price of light crude will likely find supporting fundamental factors. (…) historically, refineries try to reduce their crude stockpiles before year-end tax assessments based on storage levels.
Yesterday, the American Petroleum Institute said that U.S. crude inventories fell by 12.4 million barrels in the week ended November 29, compared to expectations for a decline of 1.25 million barrel.
Taking the above into account, there are speculation that today’s more closely-watched report from the U.S. government Energy Information Administration will show the first drop in U.S. inventories since September. If we see such drop, crude oil will receive a boost and we'll likely see further improvement in the oil market.
Having discussed the above, let’s move on to the technical changes in the crude oil market (charts courtesy of http://stockcharts.com).
Quoting our previous previous Oil Trading Alert:
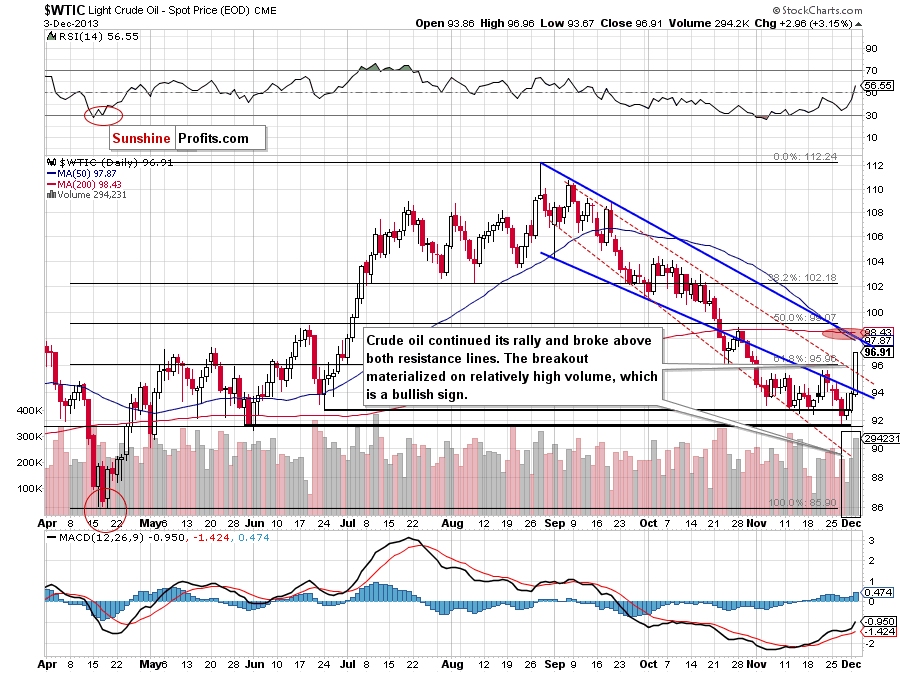
(…) crude oil (…) approached the lower border of the declining trend channel, which is a major short-term resistance level. (…) at the end of last month, crude oil broke above this resistance level and came back in the range of the declining trend channel in terms of intraday lows. Back then, the proximity to the upper border of the declining trend channel in terms of daily closing prices (marked with the red dashed line) encouraged oil bears to act and light crude invalidated the breakout, which resulted in a new monthly low. Taking this fact into account, it seems that a bigger pullback is likely to be seen after a breakout above the Nov. 21 high, which is slightly above both resistance lines.
Looking at the above chart, we see that crude oil continued its rally during Tuesday’s session and broke above both major short-term resistance levels. Additionally, the breakout materialized on relatively high volume, which confirms the strength of the buyers.
With the recent upswing, crude oil came back above the previously-broken medium-term support line and the long-term one, which is an additional bullish signal. On top of that, the WTIC:XOI ratio invalidated the breakdown below the support line based on the 2012 and 2013 lows and the oil-stocks-to-oil ratio bounced off a strong resistance zone. As a reminder, there has been a strong negative correlation between this ratio and the price of light crude in recent months. 2 weeks ago we wrote in our Oil Investment Update that if the ratio declined, we would likely see the bottom of the current correction. Connecting the dots, it seems that the worst is already behind oil bulls.
Once we know the current situation in crude oil, let’s take a look at the NYSE Arca Oil Index (XOI) weekly chart.
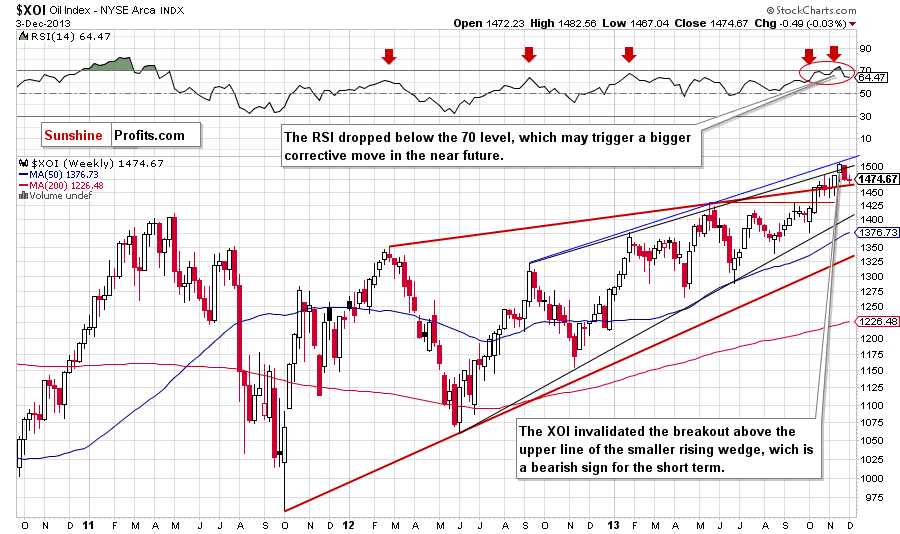
Looking at daily closing price, we clearly see that the situation didn’t change. Although we saw another intraday breakdown below the bottom of the previous correction the XOI rebounded and closed the day at the same level as day before. Therefore, what we wrote in our previous Oil Trading Alert is still up-to-date.
(…) the XOI rebounded and reached the level of the previous 2013 high. However, this resistance level stopped further growth and the oil stock index declined to 1,474.From this point of view, (…) it seems that as long as the XOI remains below this resistance a pullback to the annual high is unlikely.
Looking at the above chart we see that oil stocks dropped to the upper line of the rising wedge. Therefore, as long as this support is not broken, the space for further declines seems limited. However, if this support line is broken and the XOI confirms a breakdown below 1,470, we will likely see further deterioration. In this case, the downside target will be around 1,445 (marked with the green rectangle) where the upper line of the rising wedge intersects with the 50-day moving average and the bottom of the correction that we saw at the beginning of November.
Summing up, the short-term situation has improved as crude oil broke above both short-term resistance lines on relatively high volume. Additionally, light crude came back above the previously-broken medium-term support line and the long-term one, which is another bullish signal.
Very short-term outlook: bullish
Short-term outlook: bullish
MT outlook: mixed with bullish bias
LT outlook: mixed
Trading position (short-term): Taking the above into account we suggest opening long positions in crude oil. Stop-loss order for these positions: $91.55. We will keep you informed should anything change, or should we see a confirmation/invalidation of the above.
Thank you.
Nadia Simmons
Sunshine Profits' Crude Oil Expert
Oil Investment Updates
Oil Trading Alerts

