
On Wednesday, crude oil increased after the U.S. Energy Information Administration (EIA) data showed that crude supplies rose less than analysts had expected last week amid stronger product demand. However, light crude reversed course after Federal Reserve officials’ comments. In this way, crude oil finished slightly lower and gained 0.49%.
Yesterday, the U.S. Energy Information Administration said in its weekly report that crude stockpiles climbed by 375,000 barrels to 388.5 million barrels in the week ended Nov. 15. Please note that U.S. crude supplies have climbed by 32.8 million barrels, or 9.2%, over the past nine weeks and are at their highest level since late June. However, implied demand for petroleum products climbed to 20.4 million barrels and was the highest such figure for any week in nearly three years. The increase was driven by gains in distillate fuel, which rose by 543,000 barrels week-to-week to 4.3 million barrels, a six-year high for the period.
This much-lower-than-expected rise in U.S. crude inventories had a positive impact on light crude and pushed the price above $94 per barrel. However, crude oil reversed course after Federal Reserve officials said they expect to begin scaling back the central bank's economic stimulus program "in coming months." Nevertheless, the Fed said it would keep short-term interest rates near zero at least until the jobless rate falls to 6.5%, as long as inflation doesn't rise above 2.5%.
The inventory data and the minutes of the Fed’s October meeting were released on the same day that talks between Iran and world powers started in Geneva, concerning Iran's nuclear ambitions. As a reminder, a potential agreement between those nations could restrict parts of Iran's nuclear program in exchange for the West easing some of its economic sanctions on Tehran. The main concern for oil market investors is that a possible deal could lead to the return of more than one million barrels of oil to an already well-supplied global market.
Having discussed the above, let’s move on to the technical changes in the crude oil market (charts courtesy of http://stockcharts.com).
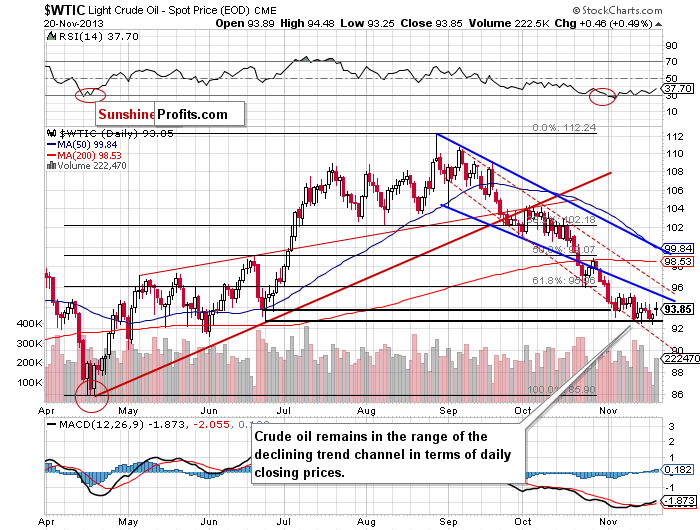
Yesterday, after the market open crude oil moved lower and hit its daily low of $93.25. However, this deterioration was only temporary. Crude oil reversed course and rose in the following hours to its daily high of $94.48. In this way, light crude almost reached the Nov. 15 high of $94.55, but this resistance level stopped further growth and the price slipped below $94 once again.
As you can see on the above chart, recent days have formed a consolidation. If oil bulls manage to push the price above the Nov. 15 high, we will likely see further improvement. In this case, the first strong resistance will be the Nov. 11 high, which intersects with the lower border of the declining trend channel in terms of intraday lows (marked with the blue bold line). On the other hand, if buyers show weakness we will probably see a re-test of the November low.
Please note that crude oil still remains in the range of the declining trend channel in terms of daily closing prices (marked with the red dashed line). The nearest support is the November low – slightly below the bottom of the corrective move that we saw back in June (in terms of intraday lows). The next one is the lower border of the declining trend channel (currently around $91.30).
Once we know the current situation in crude oil, let’s move on to the XOI daily chart.
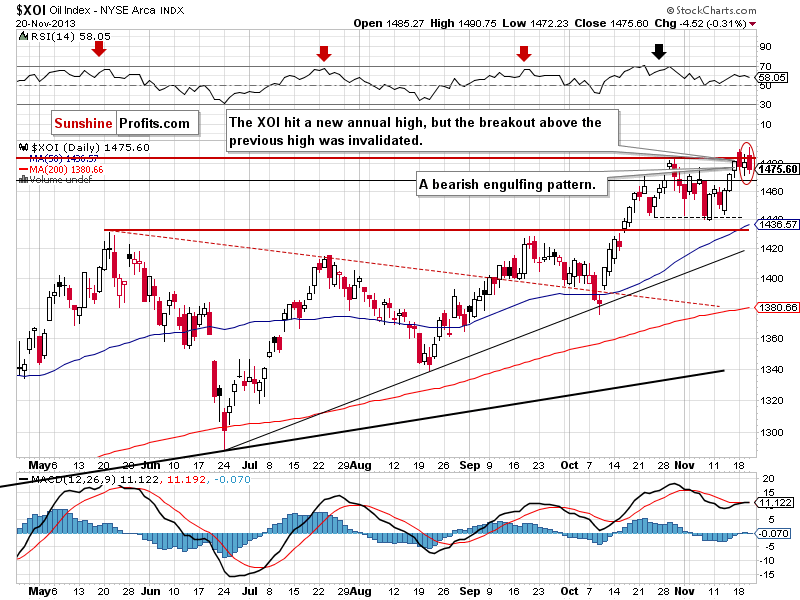
As you can see on the above chart, yesterday after the open the XOI moved higher and hit a fresh annual high at 1,490. However, after this increase the oil stock index reversed course and declined in the following hours to its daily low at 1,472. In this way, the breakout above the previous 2013 high was invalidated, which is a bearish sign.
Additionally, when we take a closer look at the daily chart, we see a bearish engulfing pattern. According to theory, a bearish engulfing pattern may provide an indication of a future bearish trend. This type of pattern usually accompanies an uptrend in a security, possibly signaling a peak or slowdown in its advancement. Taking the above into account, this bearish pattern may encourage sellers to act and result in a corrective move – especially when we take into account the upper line of the smaller rising wedge.
We wrote about this strong resistance in our previous Oil Trading Alert:
(…) the upper line of the smaller rising wedge on the weekly chart, which successfully stopped growth at the end of October, is still in play. Despite yesterday’s growth, the XOI remains below this line, which serves as strong resistance (currently around 1,495). Therefore, we should keep an eye on the oil stock index because the sellers may lock profits and trigger another correction in the coming days.
Keep in mind that the nearest support zone is created by last Wednesday’s low and the bottom of the recent corrective move (between 1,439 and 1,444).
Summing up, the situation hasn’t changed much. Although crude oil rebounded, it still remains below the lower border of the declining trend channel in terms of intraday lows. Therefore, it seems that as long as this strong resistance is in play, further growth is limited.
Trading position (short-term): Taking into account the medium- and short-term picture, we do not suggest opening any positions. If we see a confirmed breakout above the lower border of the declining trend channel in terms of intraday lows (marked with the blue bold line) we will consider opening long positions. We will keep you informed should anything change, or should we see a confirmation/invalidation of the above.
Thank you.
Nadia Simmons
Sunshine Profits' Crude Oil Expert
Oil Investment Updates
Oil Trading Alerts

