
Trading position (short-term; our opinion): Short, however, if crude oil closes the day above the 200-day moving average, it would be justified to close these positions.
On Wednesday, crude oil gained 1.09% as stronger-than-expected data on U.S. durable goods orders weighted on the price. In this way, light crude closed the day above the psychological barrier of $100 for the first time since March 10.
Yesterday, the Commerce Department showed that U.S. durable goods orders rose 2.2% last month, beating expectations for a 1% increase. Meanwhile, core durable goods orders (without transportation items) moved up 0.2%, slightly below forecasts for a 0.3% gain. These solid numbers fueled expectations that the U.S. economy will continue to recover and will demand more fuel and energy. In reaction to this, as mentioned earlier, light crude extended gains and came back above $100 per barrel.
Having discussed the above, let’s move on to the technical changes in the crude oil market (charts courtesy of http://stockcharts.com.)
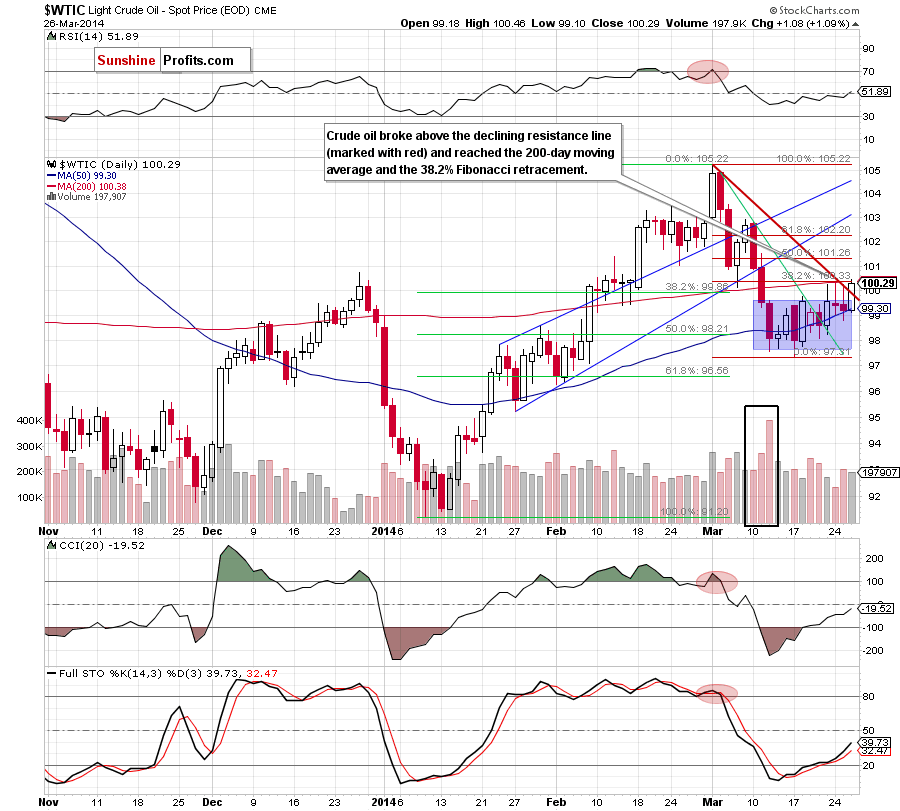
On the above chart, we see that crude oil successfully broke above the declining resistance line and reached a strong resistance zone created by the 200-day moving average and the 38.2% Fibonacci retracement once again. However, this time oil bears didn’t show their claws and light crude closed the day above the psychological barrier of $100, which was a bullish signal. Additionally, buy signals generated by the indicators remain in place, which suggests that further improvement is likely to be seen in the coming day (or days) – especially if crude oil closes the day above the resistance zone.
Having discussed the current situation in light crude, let’s take a look at WTI Crude Oil (the CFD).
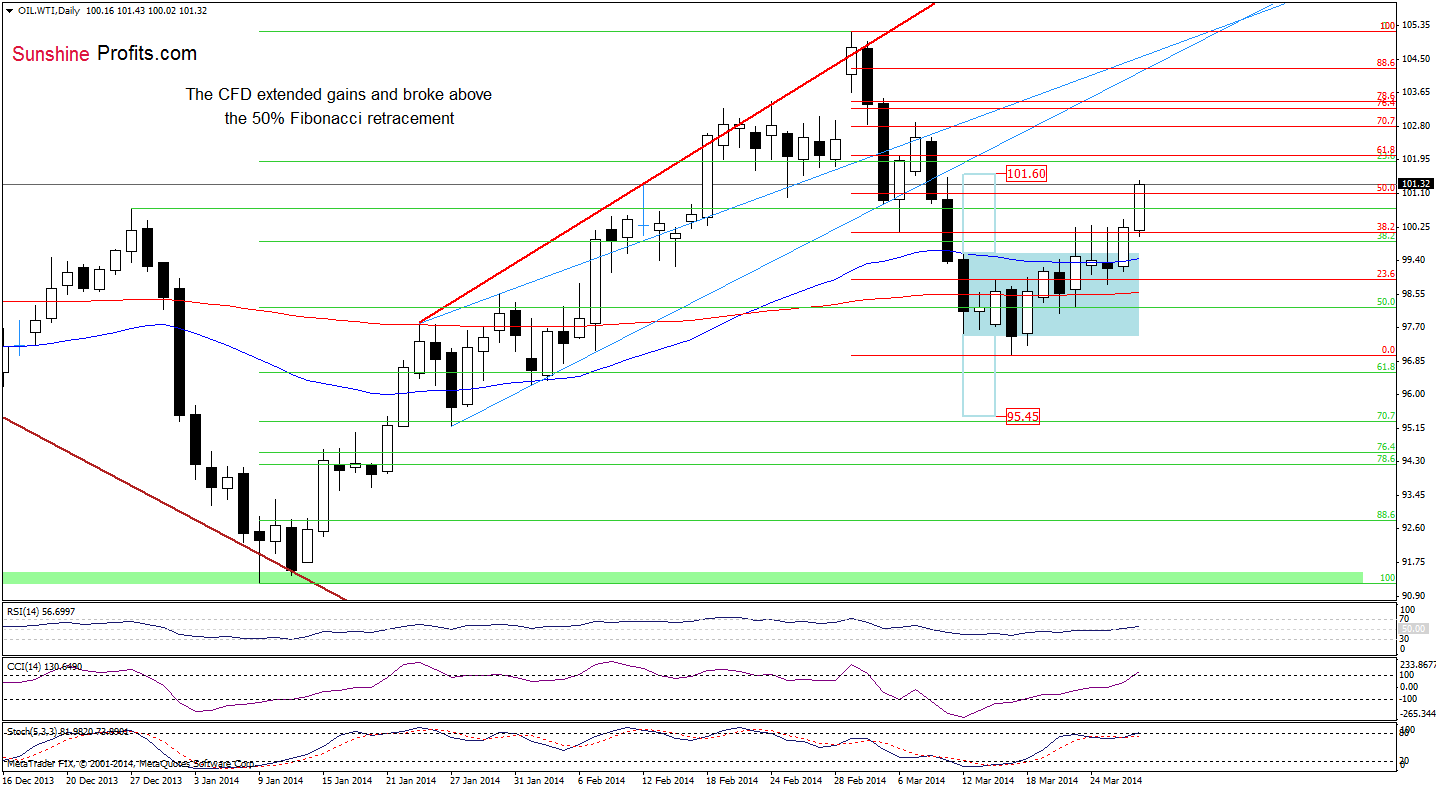
As you see on the daily chart, WTI Crude Oil closed yesterday’s session above the 38.2% Fibonacci retracement. This bullish signal encouraged buyers to act and triggered further improvement earlier today. As you see on the daily chart, the CFD extended gains and broke above the 50% Fibonacci retracement. Taking this fact into account, it seems that oil bulls will realize a pro growth scenario (after a breakout above the upper line of a consolidation range) and reach the upside target around $101.60. Please note that if the CFD breaks above this level, we will likely see an increase to the 61.8% Fibonacci retracement (around $102).
Summing up, the very short-term situation has improved as crude oil broke above the red declining line and closed the day above the psychological barrier of $100. Taking these bullish facts into account and combining with the current situation in the CFD, it seems that the buyers will try to close the day above the 200-day moving average. If we see such price action, light crude will likely extend gains in the coming days.
Very short-term outlook: mixed with bullish
Short-term outlook: mixed
MT outlook: bullish
LT outlook: mixed
Trading position (short-term): If crude oil closes the day above the 200-day moving average, it would be justified to close short positions. We will keep you informed should anything change as far as our opinion is concerned, or should we see a confirmation/invalidation of the above.
Thank you.
Nadia Simmons
Forex & Oil Trading Strategist
Forex Trading Alerts
Oil Investment Updates
Oil Trading Alerts

