
Trading position (short-term; our opinion): Long positions with a stop-loss order at $89 are justified from the risk/reward perspective. Initial price target: $96.
Although crude oil moved sharply lower after the market’s open as soft Chinese factory data watered down the price, the commodity reversed and rebounded as mixed U.S. data weakened the greenback. As a result, light crude gained 0.69% and bounced off the strong support area. Will we see further improvement?
On Saturday, official data showed that China's industrial production rose at an annualized rate of 6.9% last month, missing estimates for a gain of 8.8% and slowing from an increase of 9.0% in July. It was the weakest pace in nearly six years, which fueled concerns over a slowdown in the world’s second largest economy and pushed crude oil to slightly above the Thursday’s multi-month low.
Despite this drop, light crude rebounded after mixed U.S. data, which weakened the greenback. As a reminder, a softer U.S. currency is bullish for the price, making the commodity more attractive in dollar-denominated exchanges, especially among investors holding other currencies.
Please note that although data showed that the Empire State manufacturing index rallied to 27.5 from 14.7 in August (beating analysts’ expectations for an increase to 16), U.S. manufacturing activity unexpectedly fell 0.4% in the previous month. Thanks to these mixed numbers, crude oil hit an intraday high of $93.03. Will we see further rally? (charts courtesy of http://stockcharts.com).
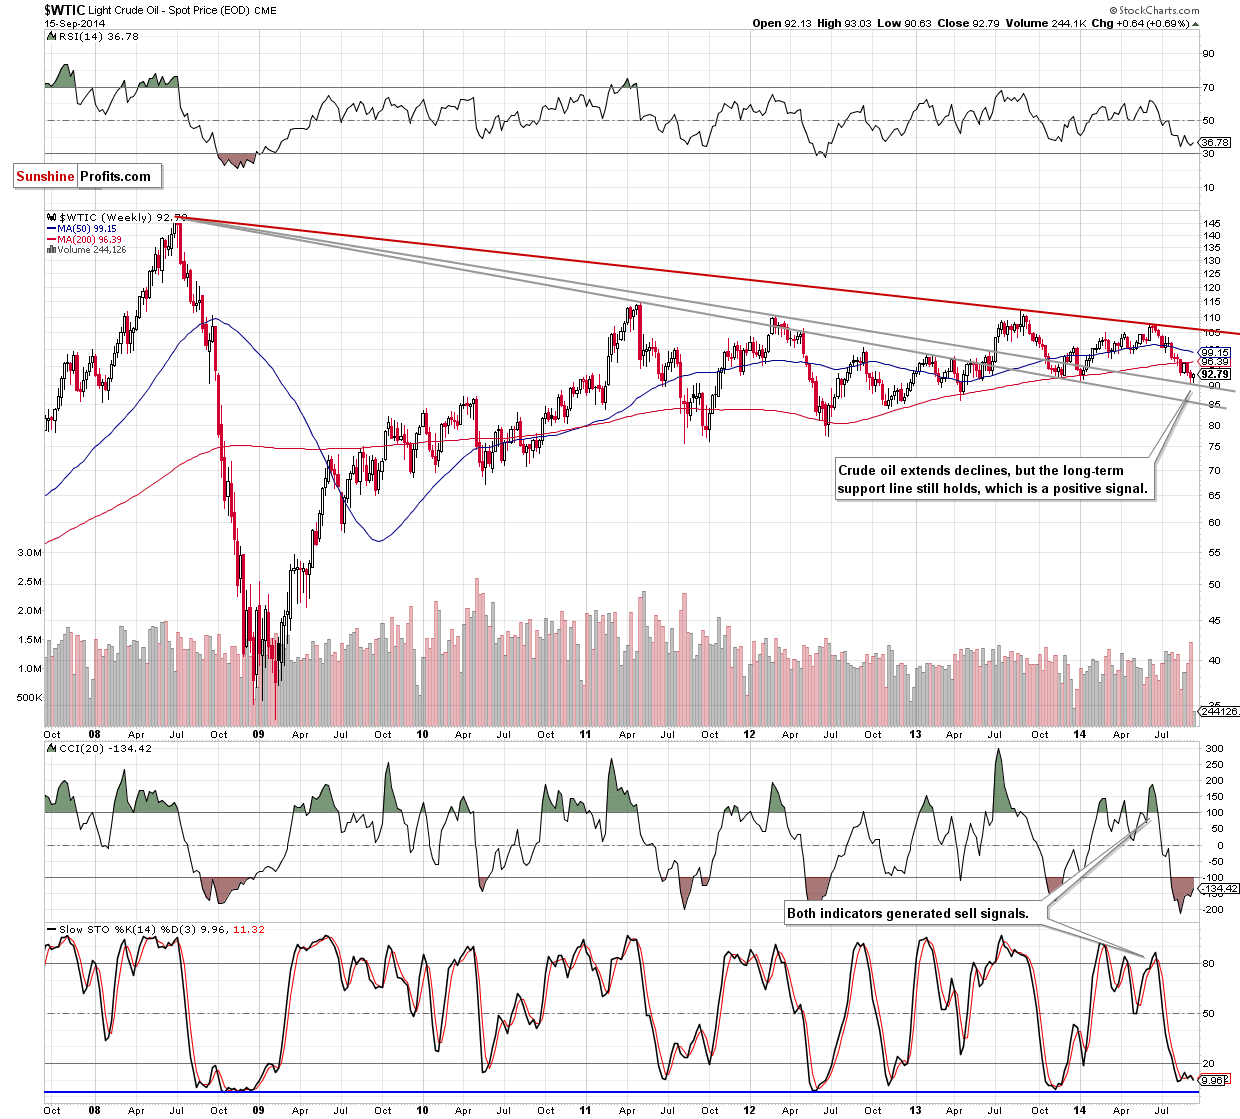
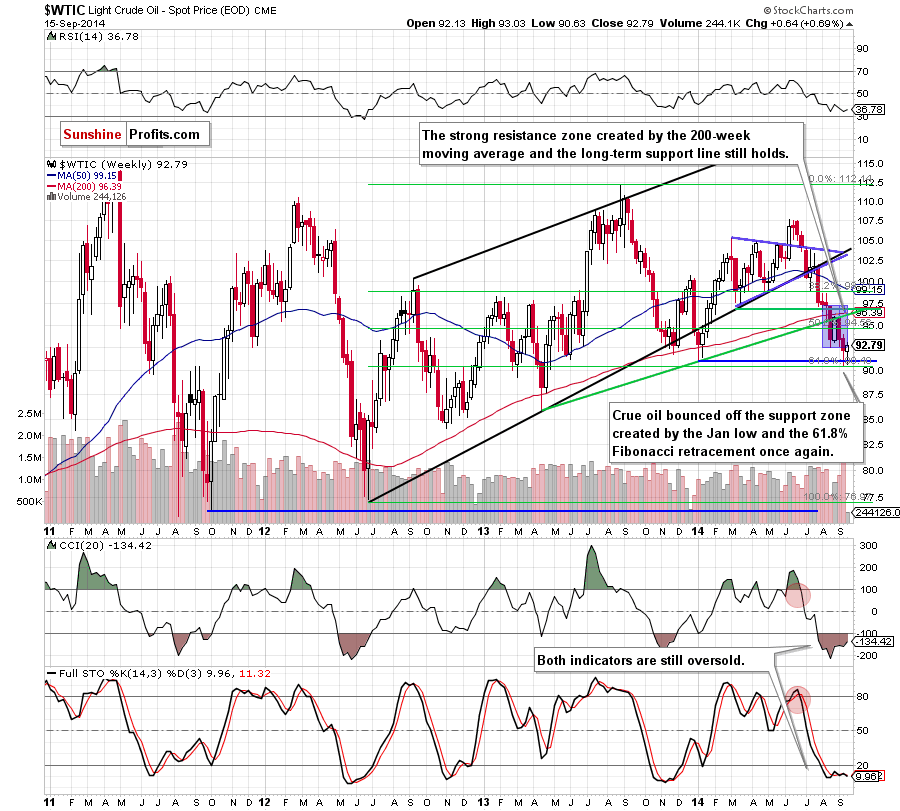
Looking at the above charts, we see that the medium-term picture has improved slightly as crude oil reversed and bounced off the solid support zone created by the long-term declining support line (marked with grey), the Jan low and the 61.8% Fibonacci retracement. Taking this positive circumstances into account, we believe that what we wrote on Friday is up-to-date:
(…) crude oil will rebound to at least the strong resistance zone created by the previously-broken 200-day moving average and the long-term support/resistance green line seen on the first chart.
Please note that the above-mentioned area is currently around $96.15-96.40.
Having say that, let’s check the daily chart.
Quoting our last Oil Trading Alert:
(…) although crude oil reversed and dropped below $93 once again, the commodity is still trading in the declining trend channel, well above the recent and May 2013 lows. Taking this fact into account, and combining it with the medium-term support levels, we think that even if crude oil moves lower from here, oil bulls do not give up so easily and will fight for this area in the coming day (or days).
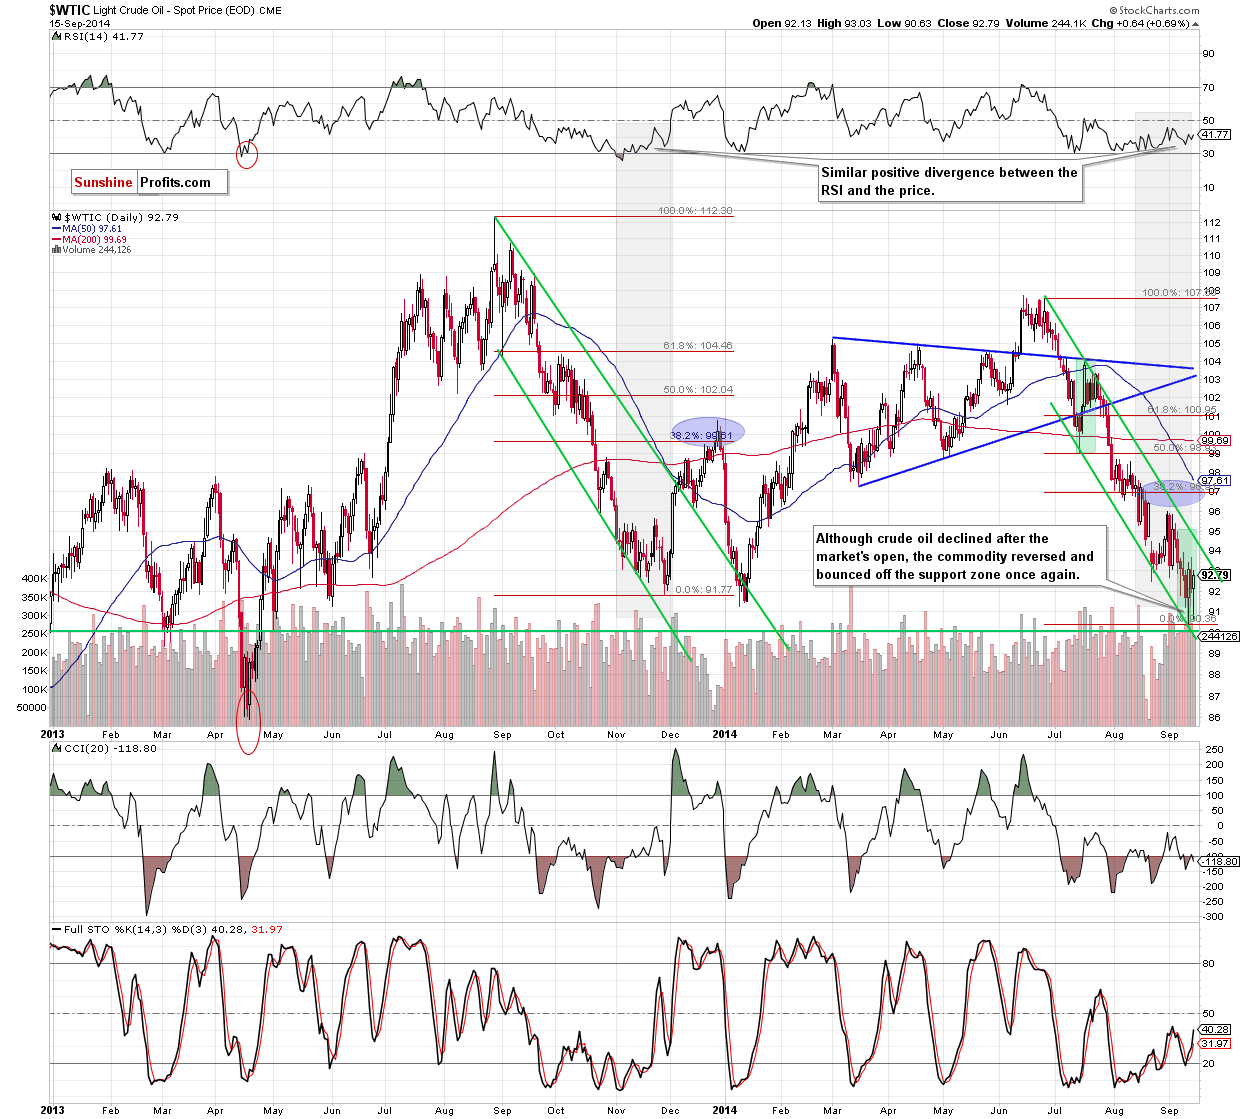
As you see on the daily chart, the situation developed in line with this pro growth scenario and crude oil bounced off the above-mentioned support levels. Therefore, what we wrote on Friday is still up-to-date:
(…) the current situation is similar to the one that we saw in November. Back then, the (…) positive divergence between the RSI and the price in combination with the lower border of the declining trend channel encouraged oil bulls to act and resulted in a sharp increase in the following days. Taking this fact into account, we think that the next bigger move will be to the upside and crude oil could rally to the 38.2% Fibonacci retracement based on the entire Jun-Sep decline (around $97). Nevertheless, before we see a realization of this scenario oil bulls will have to push the commodity above the upper line of the declining trend channel (currently around $94.50).
Summing up, we are still convinced that long positions are justified from the risk/reward perspective as crude oil bounced off the strong support zone created by the long-term declining support line, the 61.8% Fibonacci retracement level based on the Jun 2012-Aug 2013 rally, the lower border of the declining trend channel and the May 2013 low. In our opinion, as long as there is no breakdown below this area, another sizable downward move is not likely to be seen.
Very short-term outlook: bullish
Short-term outlook: mixed with bullish bias
MT outlook: bearish
LT outlook: bullish
Trading position (short-term): Long with a stop-loss order at $89. We will keep you informed should anything change, or should we see a confirmation/invalidation of the above.
Thank you.
Nadia Simmons
Forex & Oil Trading Strategist
Przemyslaw Radomski, CFA
Founder, Editor-in-chief
Gold & Silver Trading Alerts
Forex Trading Alerts
Oil Investment Updates
Oil Trading Alerts

