
Trading position (short-term; our opinion): Speculative short positions in crude oil seem to be justified from the risk/reward perspective.
Although crude oil moved higher after the market’s open supported by better than expected Chinese and U.S. data, the commodity reversed and declined sharply as investors sold the commodity for profits. As a result, light crude invalidated earlier breakout and finished the day slightly above $106 per barrel. What other bearish signs sprung up on the horizon?
Yesterday, official data showed that China’s HSBC Flash Purchasing Managers Index rose to a seven-month high of 50.8 this month from a final reading of 49.4 in May, while analysts had expected the index to rise to 49.7 this month. Additionally, Markit Economic reported that U.S. manufacturing PMI rose to 57.5 in June from 56.4 in May, beating expectations for a 56.1 reading. Also yesterday, the National Association of Realtors reported that existing home sales hit 4.89 million in May, above expectations for 4.73 million units. These better-than-expected numbers supported the commodity and pushed it to an intraday high of $107.45.
Despite this improvement, crude oil reversed after investors locked in gains as Iraq's oil production continued to be untouched by ongoing violence in the country. Although militants from the Islamic State of Iraq and the Levant seized control of a number of towns near the borders with Jordan and Syria over the weekend, local media reported that Iraqi forces regained control of border crossings with Syria and Jordan yesterday, which pushed the price of light crude to the lowest levels of the session. Will we see further deterioration in the coming days? Let’s take a closer look at the technical picture of crude oil (charts courtesy of http://stockcharts.com).
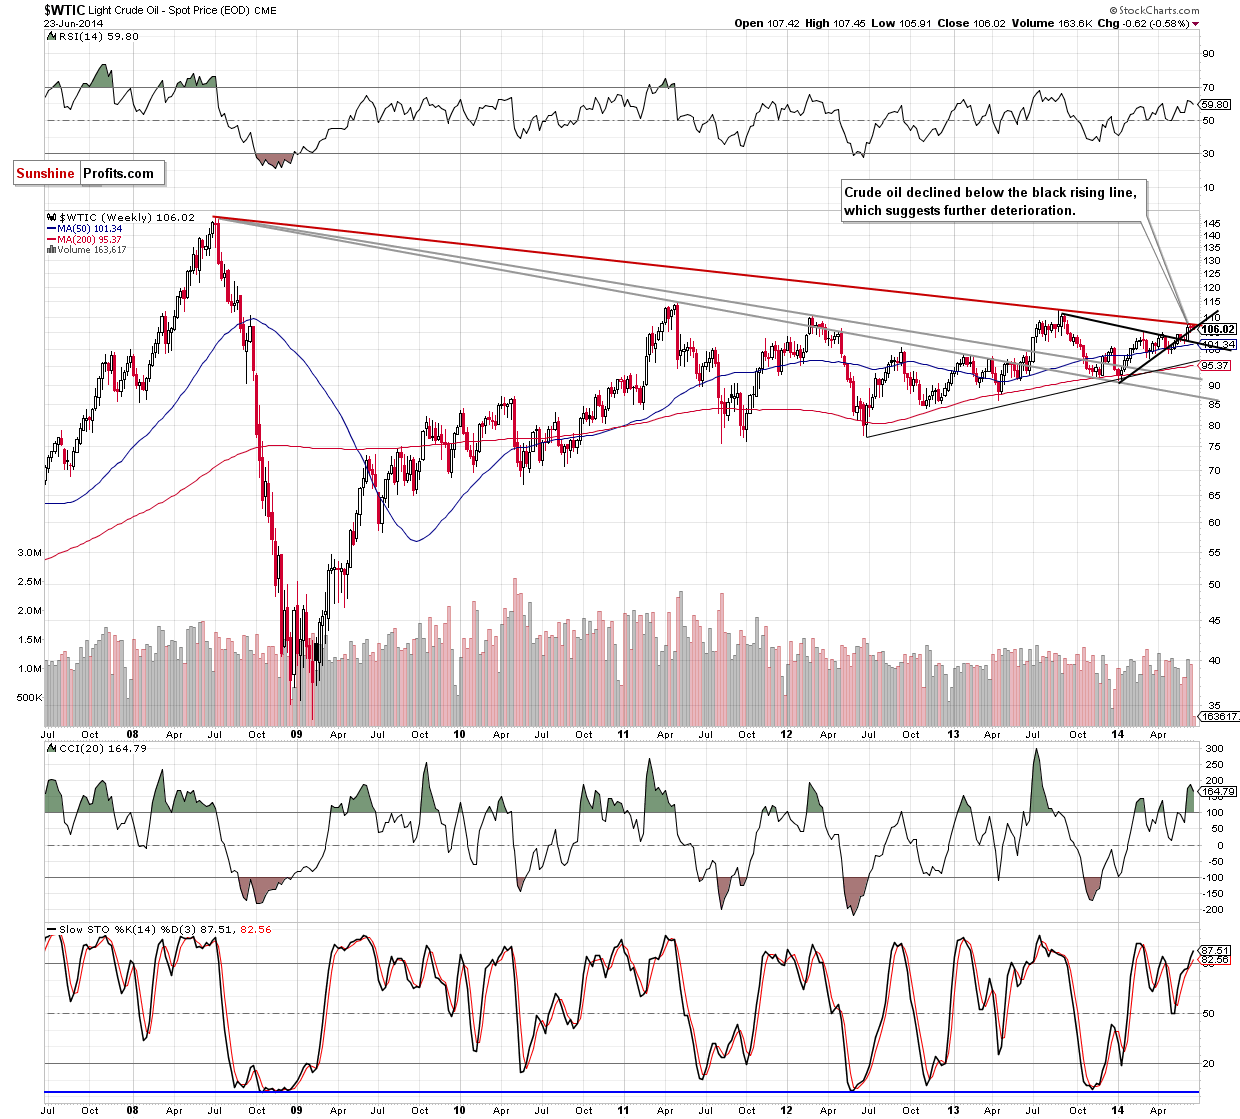
Yesterday, crude oil extended losses and declined below the black support rising line. Although this is a bearish signal, this downside move is barely visible from this perspective. Therefore, if light crude moves lower once again and oil bulls do not invalidate the breakdown, we’ll see further deterioration and a drop to around $102, where the declining black medium-term support line is. On the other hand, if the commodity came back above its nearest resistance, will see an upswing to the long-term declining line (currently around $107.50).
Will the daily chart give us any interesting clues about future moves?
Quoting our last Oil Trading Alert:
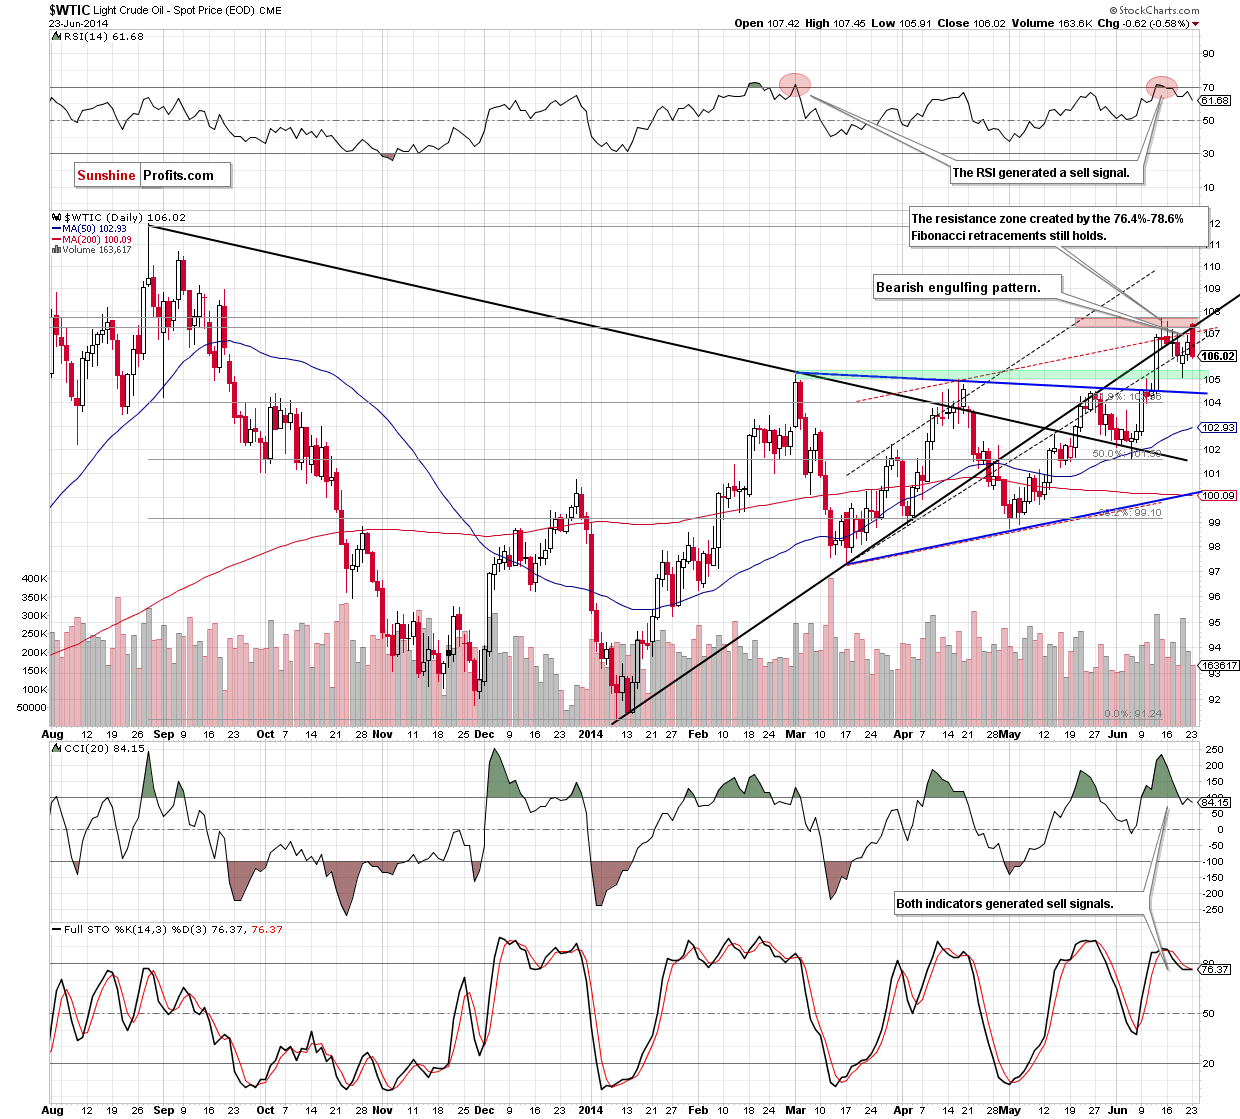
(…) despite Friday’s improvement, the commodity still remains below the medium-term black rising line and the strong resistance zone created by the 76.4% and 78.6% Fibonacci retracement levels. (…) this resistance area successfully stopped further improvement in mid-June, triggering the recent decline. Therefore, we believe that if history repeats itself once again, we will see another pullback from here in the coming days. If this is the case, the initial downside target for oil bears will be the support zone created by the previous highs (marked with green). Please note that the current position of the indicators supports the bearish case as sell signals are still in play.
Looking at the above chart, we see that although crude oil came back above the medium-term black rising line, this improvement was only very temporarily as the above-mentioned resistance zone stopped gains once again. As a result, the commodity reversed, dropping below the key support/resistance line and invalidating earlier breakout. This strong bearish signal triggered a sharp decline, which took crude oil below $106. Additionally, the recent daily candlesticks created a bearish engulfing pattern, which suggests that further deterioration is more likely than not (especially when we take into account the fact that this formation occurred in the strong resistance area). Therefore, in our opinion, even if crude oil moves higher from here (similarly to what we noticed in the previous week), the combination of the above-mentioned bearish factors will stop further improvement and we’ll see a test of the strength of the green support zone. Please keep in mind that sell signals generated by the indicators remain in place and favor oil bears at the moment.
Summing up, we remain bearish as crude oil invalidated small breakout above the medium-term black rising line. As we have pointed out before, with this downswing the commodity declined sharply, creating bearish engulfing pattern, which makes the strong resistance zone even stronger. Therefore, we believe that further deterioration and lower values of crude oil are still ahead us and the initial downside target for oil bears will be around $105, where the nearest support zone is.
Very short-term outlook: bearish
Short-term outlook: mixed with bearish bias
MT outlook: mixed
LT outlook: mixed
Trading position (short-term): Short. Stop-loss order at $109.20. We will keep you informed should anything change, or should we see a confirmation/invalidation of the above.
Thank you.
Nadia Simmons
Forex & Oil Trading Strategist
Przemyslaw Radomski, CFA
Founder, Editor-in-chief
Gold & Silver Trading Alerts
Forex Trading Alerts
Oil Investment Updates
Oil Trading Alerts

