
Trading position (short-term; our opinion): Long positions with a stop-loss order at $85.96 are justified from the risk/reward perspective. Initial price target: $96.
The price of crude oil declined yesterday and it’s declining also today. The “black gold” is now below its previous 2014 low, but still above its 2013 low. Will it finally reverse or was the June – Oct decline just a beginning? Let’s jump right into charts and see the answer (charts courtesy of http://stockcharts.com.)
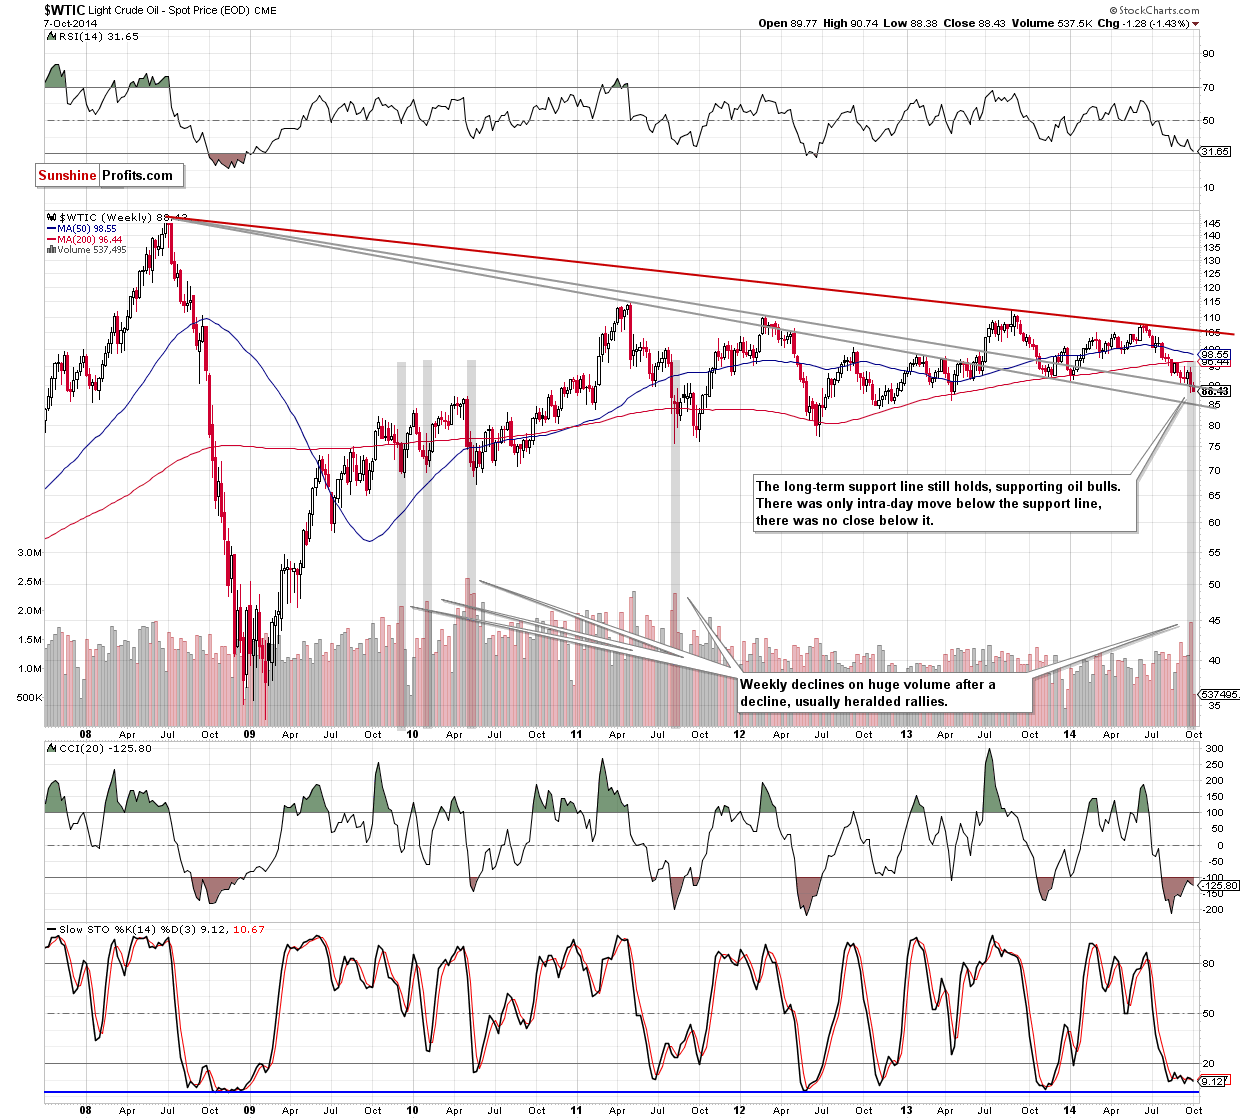
From the long-term perspective – which is the key one at this time, as it is the long-term support that was just reached – only a little has changed. Crude oil moved a bit below the support line, but it the week is not over yet, so this move doesn’t have to be meaningful. In fact, it’s not meaningful just yet. Crude oil has not only closed below it for just one day, but has also just (last week) invalidated a similar intra-week breakdown. Consequently, unless we see a confirmation of the breakdown, it doesn’t seem that one should put much weight to it.
All in all, our yesterday’s comments remain up-to-date:
From the long-term perspective, we see that the long-term support line held last week, even though we saw a quick move below it. This move hasn’t changed anything because it was not only quick, but also temporary – crude oil price reversed almost immediately and overall crude oil gained on that day (Thursday).
It seems that if it weren’t for the massive rally in the USD Index that we’ve seen on Friday, the rally in crude oil would already be underway. Instead, we saw another daily decline. It’s important to note that crude oil declined relatively insignificantly as compared to the size of the move in the USD Index. In a way, Friday’s decline was a show of strength in the price of “black gold”. All in all, since the long-term support line was not successfully broken, the price of crude oil is likely to move higher in the coming weeks (and perhaps days).
Before moving on to the short-term picture, we would like to draw your attention to the size of the volume that we saw last week’s decline. It was very significant, and when we saw something similar in the past (huge-volume decline after a visible downswing), it meant that the decline is either over or very close to being over. Consequently, the above-mentioned bullish comments are confirmed also from this angle.
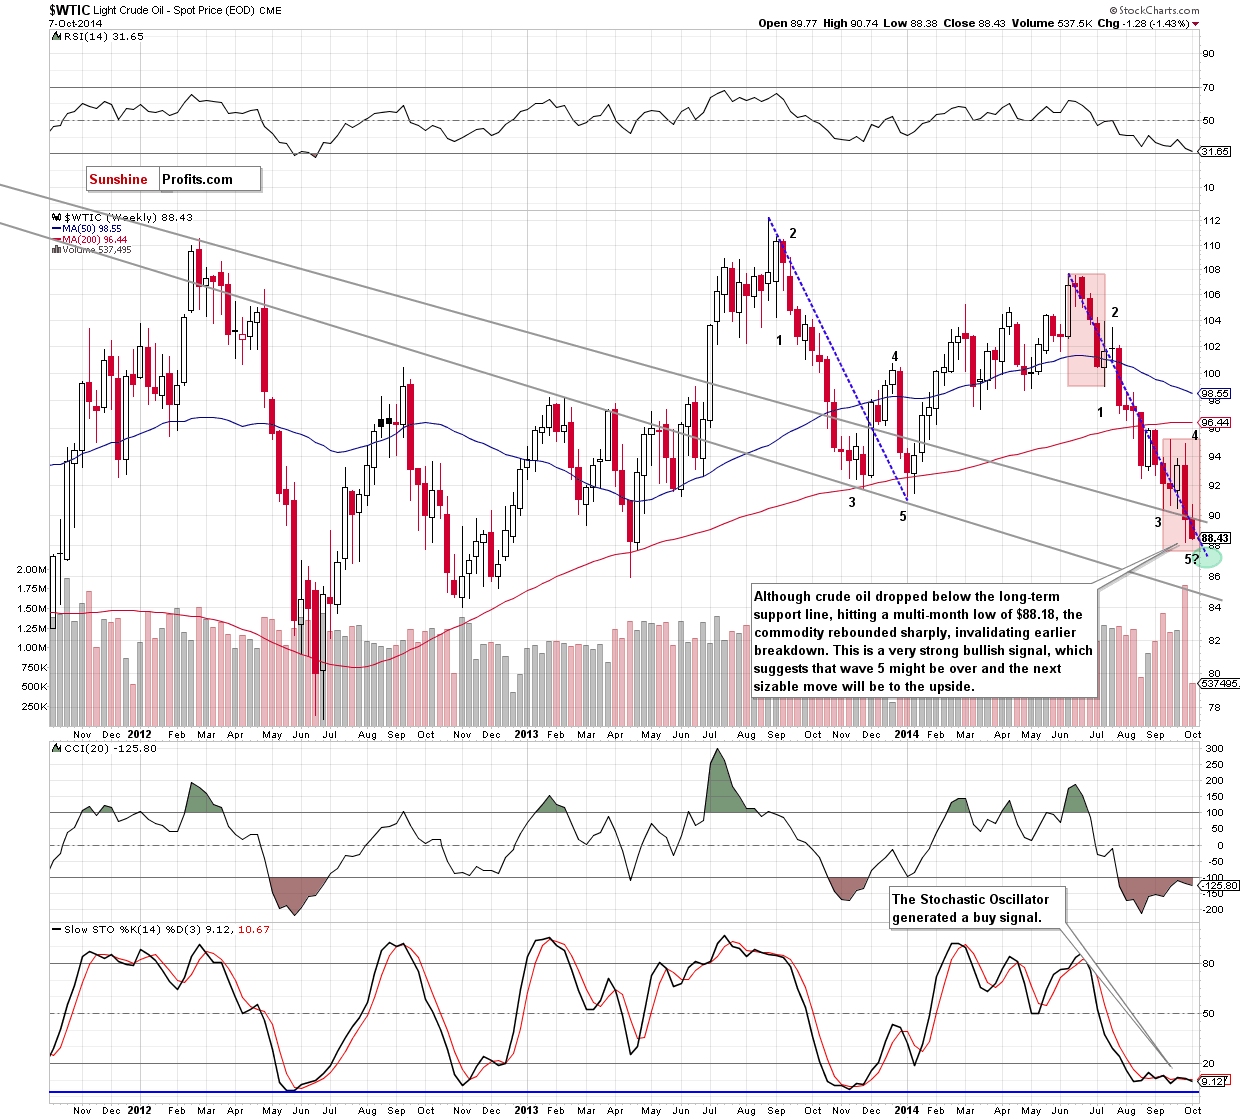
Please note that today crude oil moved right into our price target area and it seems to be completing the 5th wave that we have commented on previously. Moreover, the decline is now almost identical in terms of price and time to the one seen last year. Overall, what we wrote yesterday, remains up-to-date:
As you see on the above chart, the situation developed in line with our yesterday’s scenario as crude oil declined [on Thursday] to a fresh multi-month low of $88.18 and then rebounded sharply, invalidating earlier breakdown. This is a strong bullish signal – especially, when we factor in the fact that with this upswing, the commodity invalidated also a breakdown under the long-term support line and the 61.8% Fibonacci retracement (both seen more clearly on the charts below). What’s interesting, despite yesterday’s drop, crude oil didn’t even slipped below the lower border of the declining trend channel, which is another positive sign. On top of that, the volume that accompanied yesterday’s move was huge (the highest since Oct 2012), which signifies to us the real direction in which the commodity is heading. Please note that crude oil reached the upper line of the declining trend channel, which may trigger a pullback from here. However, we believe that even if it appears, it will be shallow and short-lived.
(...)
Looking at the above chart, we see that although crude oil declined below the long-term support line and the 61.8% Fibonacci retracement, this deterioration was only temporarily and the commodity invalidated the breakdown very quickly. As we have pointed out before, this is a strong bullish signal, which suggests that the next sizable move will be to the upside and the final bottom might be in (especially when we factor in the fact that wave 5 is shorter than wave 1). If this is the case, the initial target for oil bulls will be around $95, where the recent high is.
Summing up, it seems that keeping long positions is still justified from the risk/reward perspective as the breakdown below the recent lows and the key medium-term support zone was invalidated very quickly last week. This week’s “breakdown” is not yet confirmed and we doubt that it will be confirmed, as it moved right into our target area – it seems ready to move back up. It seems that the next sizable move will be to the upside, not to the downside.
Very short-term outlook: bullish
Short-term outlook: mixed with bullish bias
MT outlook: mixed
LT outlook: bullish
Trading position (short-term): Long with a stop-loss order at $85.96. We will keep you informed should anything change, or should we see a confirmation/invalidation of the above.
Thank you.
Nadia Simmons
Forex & Oil Trading Strategist
Przemyslaw Radomski, CFA
Founder, Editor-in-chief
Gold & Silver Trading Alerts
Forex Trading Alerts
Oil Investment Updates
Oil Trading Alerts

