
Trading position (short-term; our opinion): In our opinion no positions are justified from the risk/reward perspective.
On Wednesday, crude oil rebounded sharply and gained 1.96% as expectations that steps toward a ceasefire in eastern Ukraine could boost economic growth in Europe weighed on the price. As a result, light crude almost completely erased Tuesday's losses and closed the day above $95 per barrel. Is this another one-day rally or will we see further improvement in the coming days?
Yesterday, Russian President Vladimir Putin said he and his Ukrainian counterpart had agreed to take steps to establish a "permanent ceasefire" in eastern Ukraine, calling for the separatists there to end their offensive against Ukrainian forces around the rebel strongholds of Donetsk and Luhansk, while Kiev would pull its forces back. Additionally, Ukrainian President Petro Poroshenko said he hoped that talks with separatists set for Friday will lead to the start of a peace process.
Although escalating tensions between Ukraine and Russia had a positive impact on the price of crude oil in the recent months, this time we had a completely different market participants’ reaction. For the first time since the beginning of the conflict news of reduced geopolitical tension pushed the commodity higher on hopes that waning military conflicts in Ukraine could boost economic growth in Europe and lessen the chances of the crisis slowing global recovery. Does this mean that investor sentiment will improve and we see further rally? Before we know the answer to this question, let‘s examine the technical picture of light crude and find out what can infer from the charts (charts courtesy of http://stockcharts.com).
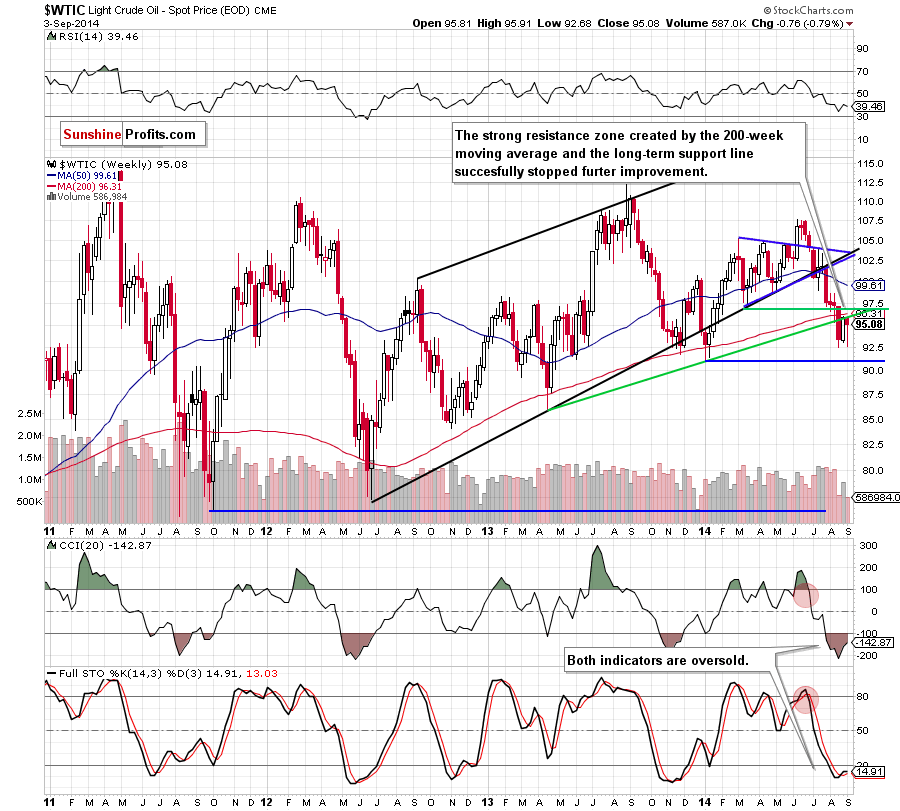
From this perspective, we see that although crude oil rebounded, the strong resistance zone created by the previously-broken 200-week moving average and the rising, long-term support line still holds, favoring oil bears. Therefore, we still think that as long as there is no invalidation of the breakdown below these levels, the medium-term outlook remains bearish. Please note that if crude oil drops below the recent lows, the last week’s upswing will be nothing more than a verification of the breakdown and we’ll see a test of the strength of the Jan low of $91.24. Nevertheless, we still keep in mind that the current position of the indicators suggests that a trend reversal is just around the corner (especially when we factor in the fact that the Stochastic Oscillator generated a buy signal).
Will the very short-term chart give us more clues about future moves? Let’s check.
Yesterday, we wrote the following:
(…) From the technical point of view, this is the point from where crude oil should go north (at least later today) as the proximity to the support level will likely encourage some investors to push the buy button.
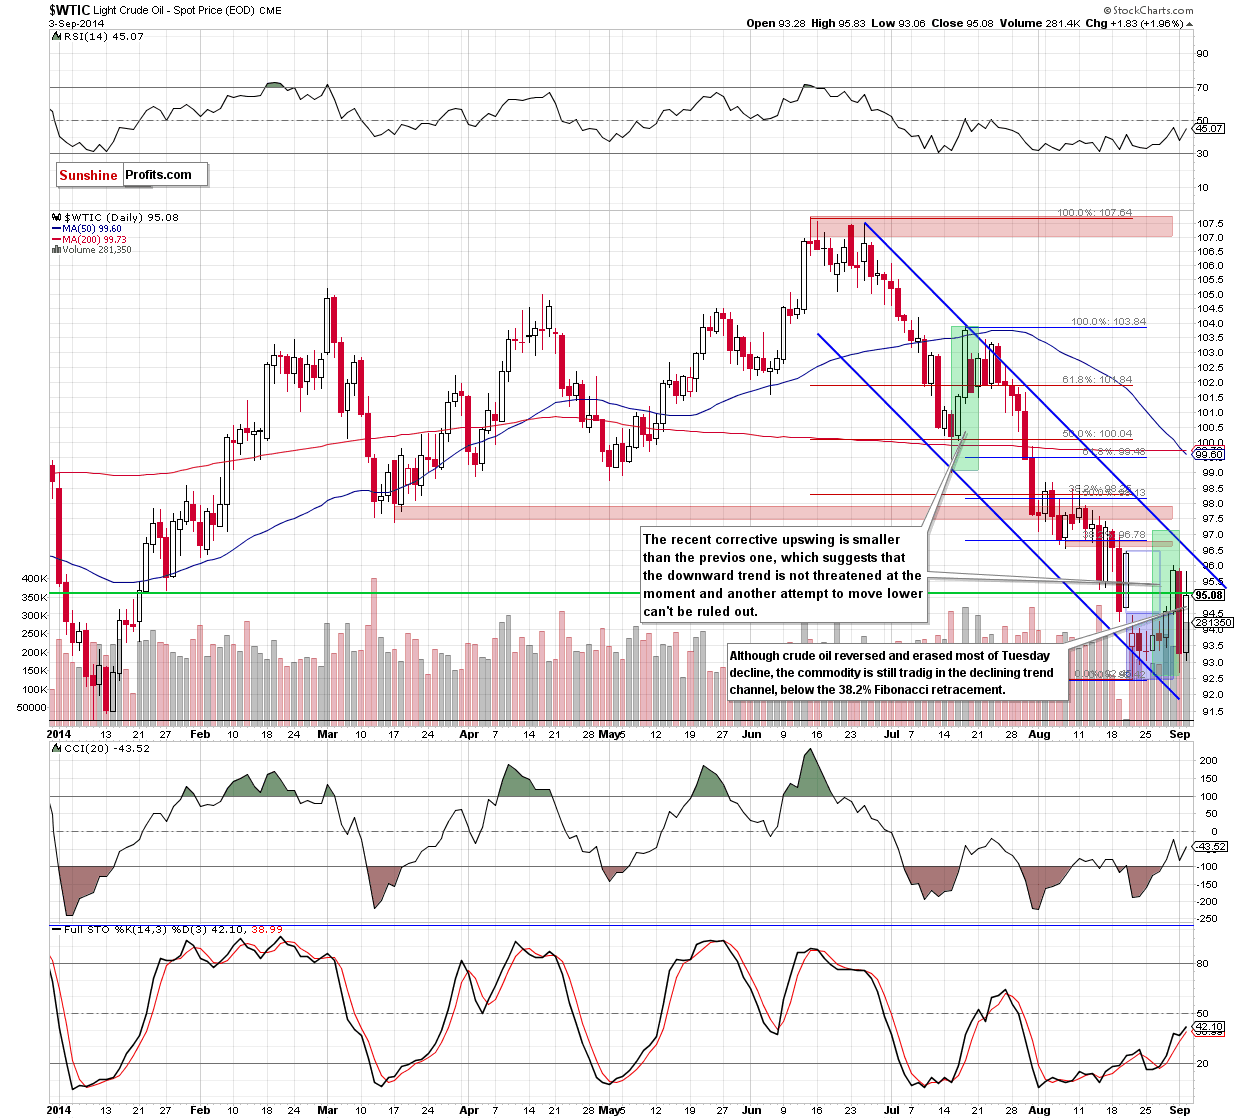
As you see on the above chart, the situation developed in line with the above-mentioned scenario and crude oil almost completely erased Tuesday's losses and closed the day above $95 per barrel. Did this move change anything? In our opinion, the answer is: no. Despithe this sharp increase, the commodity is still trading in the declining trend channel, which means that even if we see further improvement, oil bulls will have to push the price above the upper line of the formation before we’ll see another sizable upward move. At this point, it’s also worth noting that we saw similar one-day rallies in the previous month (on Aug 15 and Aug 20). Back then, none of them was strong enough to trigger further improvement. Why? Because they were much smaller than the corrective upswing that we saw in mid-July (the recent rally was also smaller). What does it mean for crude oil? We think that the best answer to this question will be our yesterday’s commentary:
(…) the recent corrective upswing is much smaller than the previous one, which means that oil bulls are even weaker than they were in July. Therefore, in our opinion, the downward trend is not threatened at the moment and another attempt to move lower should not surprise us. If this is the case, we think that the next downside target will be the combination of the 2014 low and the lower border of the declining trend channel around $91.24-$91.50.
Summing up, despite yesterday’s sharp increase, the medium-term outlook remains bearish and in our opinion opening long positions is currently not justified from the risk/reward perspective. From today’s point of view, this move is nothing more than another one-day rally, which (so far) didn’t change the very-short term outlook. Nevertheless, we should keep in mind that the major driving force behind the next move might be today’s the EIA weekly report on crude oil inventories. If it is bullish for the commodity, we’ll see further improvement and a test of the strength of the upper line of the declining trend channel. On the other hand, if the data disappoints, the commodity will likely correct yesterday’s rally or even drop to around the recent lows.
Very short-term outlook: mixed
Short-term outlook: mixed
MT outlook: bearish
LT outlook: bullish
Trading position (short-term): No positions are justified from the risk/reward perspective at the moment, but we will keep you informed should anything change.
Thank you.
Nadia Simmons
Forex & Oil Trading Strategist
Przemyslaw Radomski, CFA
Founder, Editor-in-chief
Gold & Silver Trading Alerts
Forex Trading Alerts
Oil Investment Updates
Oil Trading Alerts

