

Trading position (short-term; our opinion): No positions are justified from the risk/reward perspective.
Yesterday, the Fed announced that it had decided to leave the interest rates unchanged. However, this doesn’t mean that nothing changed. There was something that the Fed said that altered the outlook and in today’s alert we focus on the implications for the crude oil market and we’ll also discuss yesterday’s breakout above the declining resistance line.
We will start today’s Oil Trading Alert with… today’s Forex Trading Alert as in the latter we focused on the USD Index and both “nominal” and “real” implications of Fed’s comments and both topics have important implications for crude oil. In today’s Forex Trading Alert we wrote the following:
Let’s start with the long-term chart (charts courtesy of http://stockcharts.com).
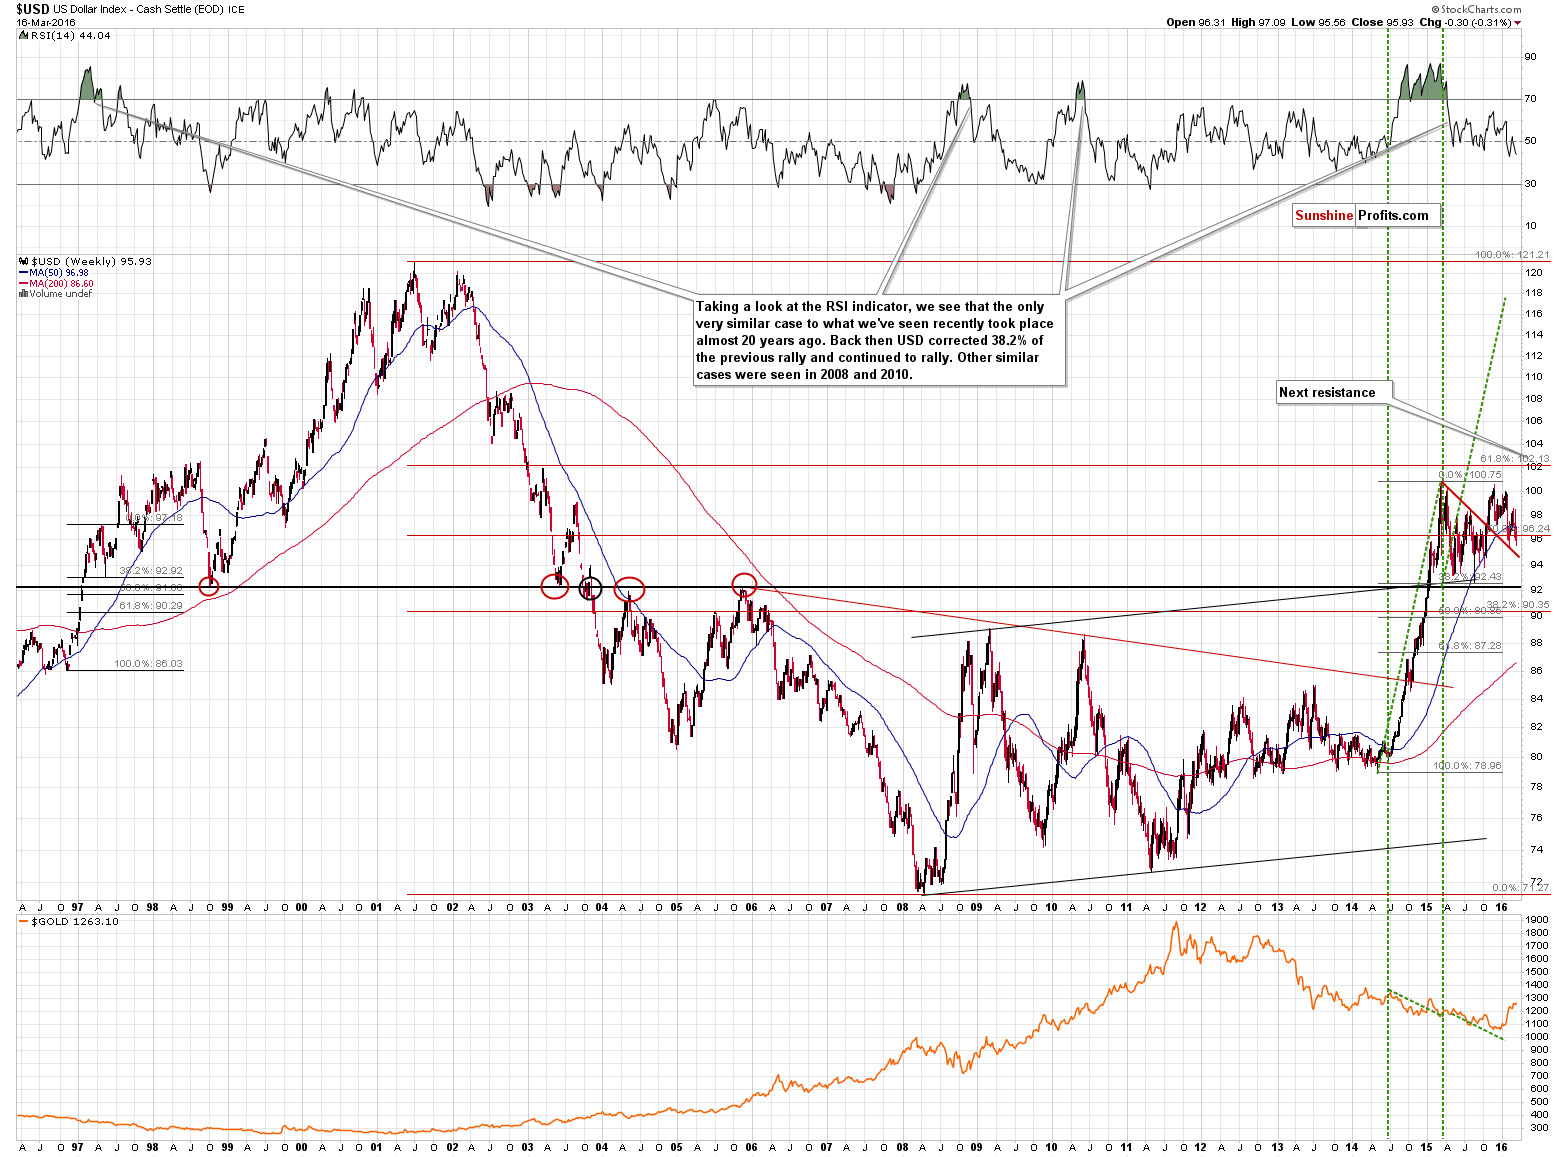
The most important thing visible on the above chart is that the USD Index is in a major uptrend, and more precisely in a consolidation within it. After breaking through the resistance of 92, the USD Index has been consolidating – and that’s perfectly natural, because the previous rally was both big and sharp.
Once the consolidation is over, the move that follows it is likely to be similar to the one that preceded it (note the green lines on the above chart) and this implies a huge rally in the coming months (likely later in 2016).
The question is when the current consolidation is going to end and the answer is based on the support levels. First of all, we don’t expect the 92 level to be broken, so even if the USD slides much lower, it doesn’t seem likely that it would result in a breakdown. Secondly, the declining, red support line is something that is likely to keep declines in check – this line is more or less being reached at the moment of writing these words.
Let’s take a look at the short-term chart.
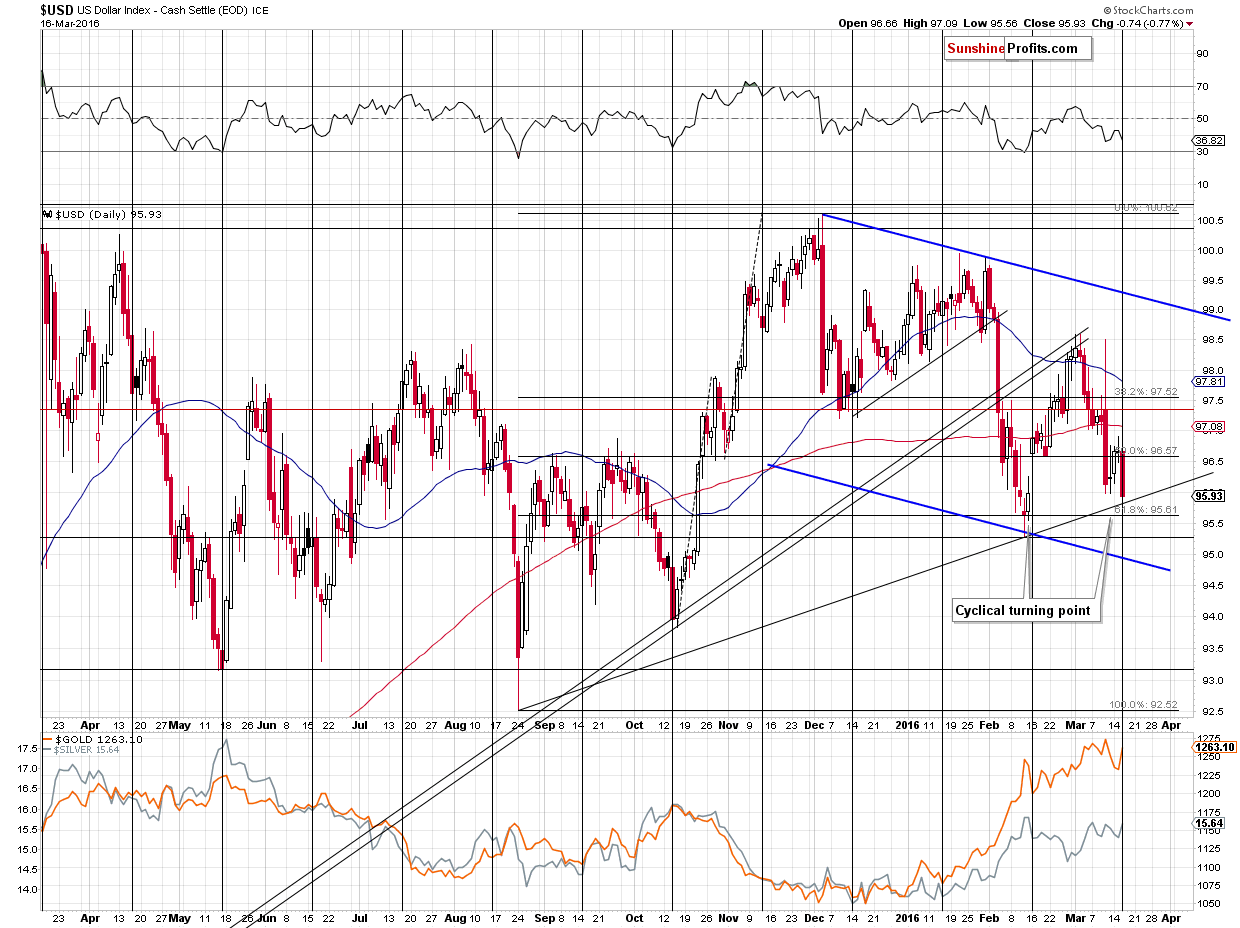
The USD Index moved to the rising support line yesterday, but this line was broken in today’s pre-market trading, so the question is: “What is the next level that could trigger a bounce or a rally?”
The February 2016 low and the lower border of the declining trend channel are both good candidates. Since they are relatively close to each other it’s quite likely that the USD will reverse either right at one of them or somewhere in between. This is where the USD Index is right now (slightly above 95).
There is one additional important factor that should be considered here – the cyclical turning point. Yesterday’s decline took place right at it and today’s move lower is still very close to it. In almost all recent cases, the turning points in the USD Index were followed by rallies and since the most recent move was definitely to the downside it appears likely that the USD Index will move higher relatively soon (perhaps even this week).
All in all, the technical picture for the USD Index is bullish.
Now, how does the announcement regarding interest rates impact the above? The impact of all important announcements should be discussed along with discussing previous expectations. Remember when the Fed lowered rates by 0.75 and the stock market plunged? It was because people were expecting an even bigger cut. It didn’t matter that the rates were lowered dramatically – it only mattered that they were lowered less than market had expected.
What did the market expect of yesterday’s announcement? Pretty much what the Fed delivered. As we are writing in today’s Gold News Monitor, investors are expecting only one rate hike this year. Consequently, since yesterday’s comments more or less confirmed the investors’ expectations, did anything change? On a “nominal” level – yes, the Fed said something else than it had been saying previously, however, on a “real” level – how this will likely impact the markets – not much changed, if anything.
Consequently, yesterday’s news is not likely to have a major impact on the markets, including the USD Index, except for a short-term impact – and this short-term impact (based on yesterday’s and today’s declines) could already be over.
Summing up, yesterday’s comments from the Fed include changes that are likely not to have a major impact on the main trends because they were in tune with what the investors had been expecting. Consequently, the technical patterns are likely to remain the key source of signals (as the news was not a game-changer) and the outlook (based on the above) for the USD Index is bullish for the medium term and there are good reasons for the USD Index to rally shortly (being at about 95 at the moment of writing these words). If it doesn’t rally, then it could move even to 92 without major medium-term implications.
The implications for the crude oil market remain bearish just as the outlook for the USD Index remains bullish. The thing that changed was the very short-term outlook in which some investors “discovered” what most investors were expecting all along – no changes in interest rates now and then just one increase in 2016. The rally in crude oil appears to be rather temporary, but still, we have yet to see meaningful bearish confirmations before entering short positions here. It doesn’t seem that we will have to wait for long, though.
Let’s examine charts and see why (charts courtesy of http://stockcharts.com)
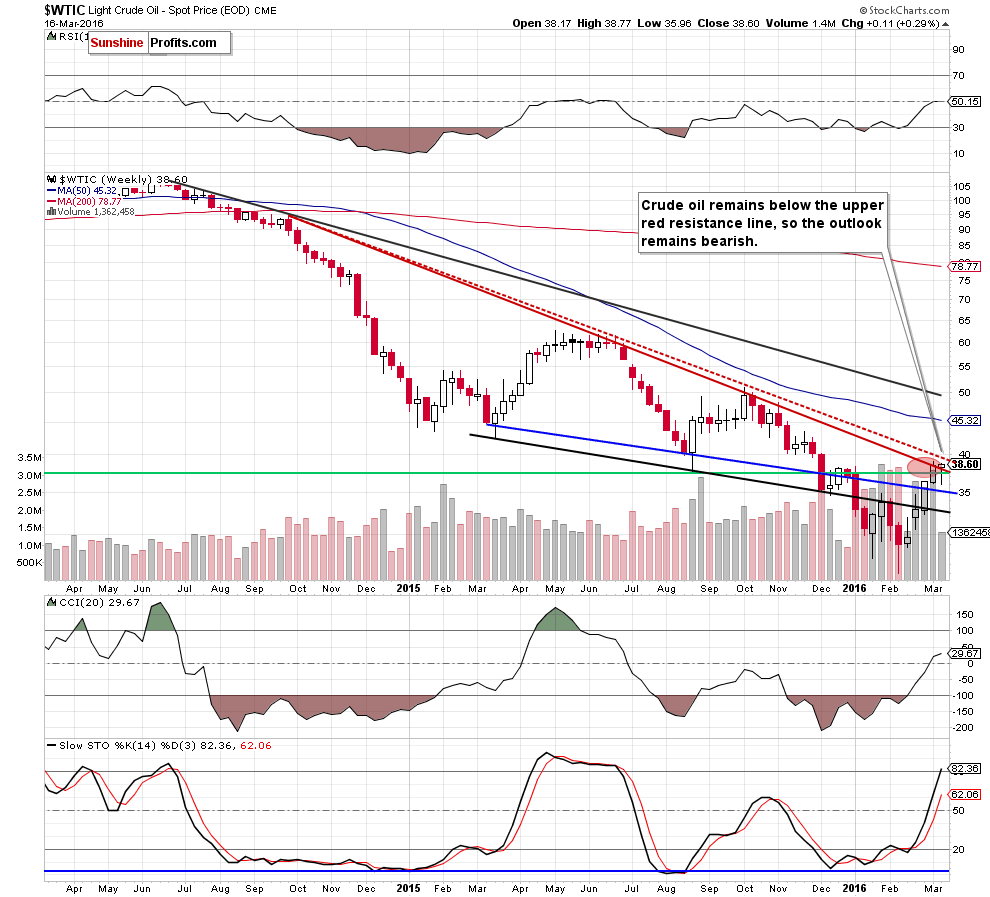
In the opening paragraph of today’s alert we wrote about a breakout above the declining resistance line. This was just a breakout above the lower of the lines and the upper one (based on intra-day highs) was not reached (at $40), let alone broken. Consequently, it’s not likely that crude oil would move much higher, even though its price did increase in today.
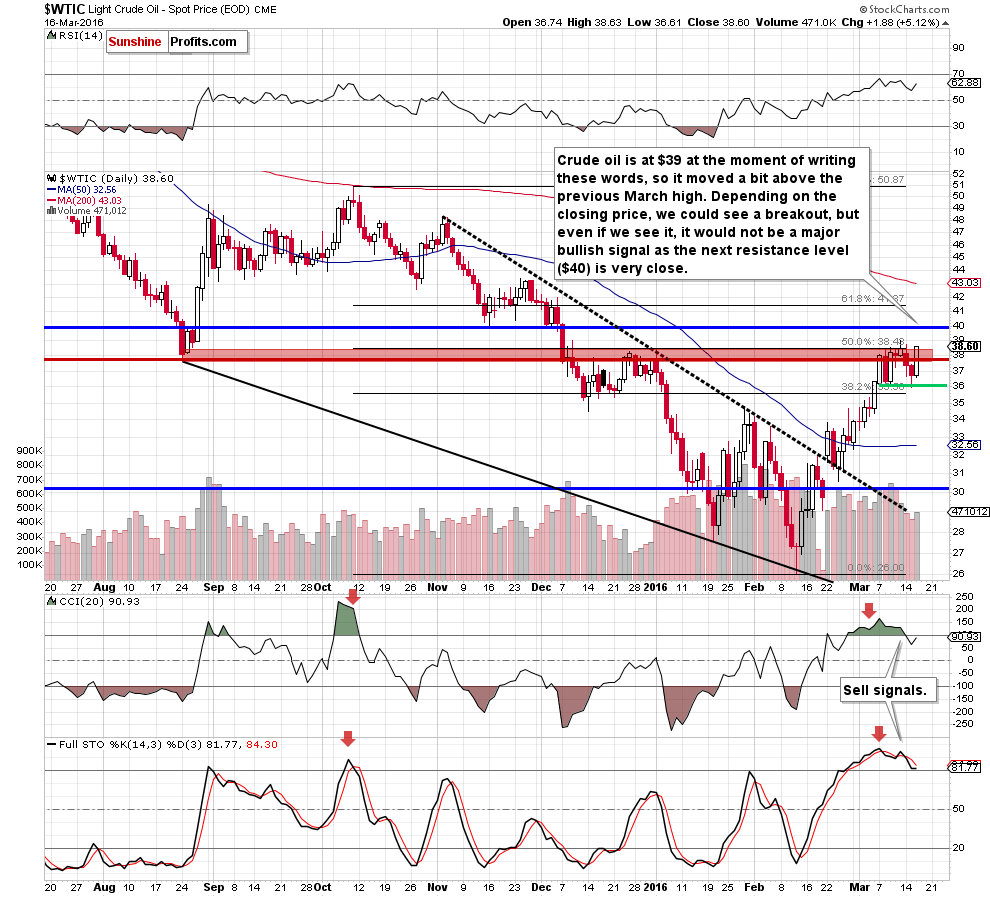
On the short-term chart we see that the $40 level is an important resistance also from this perspective. We also see that even though the yesterday’s rally was significant (over 5%), it was accompanied by relatively low volume. In fact, that was the lowest volume seen during an upswing in a few weeks. That’s a bearish sign, but on its own not bearish enough for us to open a short position at this time.
Summing up, lower values of the black gold are still more likely than not, but we would prefer to see additional bearish confirmations before entering a short position here.
Very short-term outlook: mixed with bearish bias
Short-term outlook: mixed with bearish bias
MT outlook: mixed with bearish bias
LT outlook: mixed with bearish bias
Trading position (short-term; our opinion): No positions are justified from the risk/reward perspective.
We will keep you – our subscribers – informed should anything change.
As a reminder – “initial target price” means exactly that – an “initial” one, it’s not a price level at which we suggest closing positions. If this becomes the case (like it did in the previous trade) we will refer to these levels as levels of exit orders (exactly as we’ve done previously). Stop-loss levels, however, are naturally not “initial”, but something that, in our opinion, might be entered as an order.
Since it is impossible to synchronize target prices and stop-loss levels for all the ETFs and ETNs with the main market that we provide this level for (crude oil), the stop-loss level and target price for popular ETN and ETF (among other: USO, DWTI, UWTI) are provided as supplementary, and not as “final”. This means that if a stop-loss or a target level is reached for any of the “additional instruments” (DWTI for instance), but not for the “main instrument” (crude oil in this case), we will view positions in both crude oil and DWTI as still open and the stop-loss for DWTI would have to be moved lower. On the other hand, if crude oil moves to a stop-loss level but DWTI doesn’t, then we will view both positions (in crude oil and DWTI) as closed. In other words, since it’s not possible to be 100% certain that each related instrument moves to a given level when the underlying instrument does, we can’t provide levels that would be binding. The levels that we do provide are our best estimate of the levels that will correspond to the levels in the underlying assets, but it will be the underlying assets that one will need to focus on regarding the sings pointing to closing a given position or keeping it open. We might adjust the levels in the “additional instruments” without adjusting the levels in the “main instruments”, which will simply mean that we have improved our estimation of these levels, not that we changed our outlook on the markets.
Thank you.
Nadia Simmons
Forex & Oil Trading Strategist
Przemyslaw Radomski, CFA
Founder, Editor-in-chief
Gold & Silver Trading Alerts
Forex Trading Alerts
Oil Investment Updates
Oil Trading Alerts

