

Trading position (short-term; our opinion): No positions are justified from the risk/reward perspective.
Although crude oil moved lower after the market’s open weakened by a stronger U.S. dollar, the commodity reversed in the following hours and rebounded re-approaching the barrier of $50. Where will the black gold head next in the coming week?
Let’s examine charts below and find out what can we infer from them (charts courtesy of http://stockcharts.com).
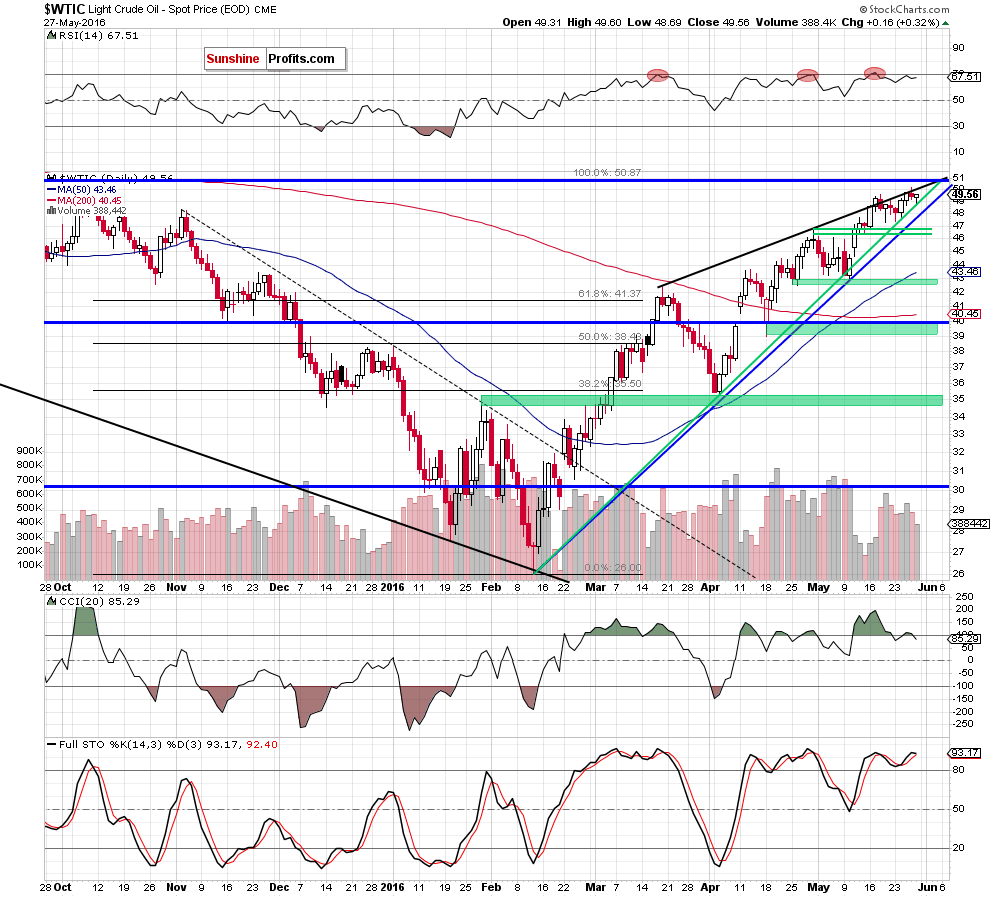
Looking at the daily chart, we see that the medium-term green support line stopped further deterioration once again and triggered a rebound on Friday. Despite this small increase, the commodity closed the day (and week) under the barrier of $50 and the black resistance line based on the Mar and Apr highs, which means that invalidation of the breakout above these important levels and its negative impact on the price is still in effect.
Taking these two negative events into account, we think that another attempt to move lower is just around the corner. If this is the case, and light crude extends declines from here, we’ll see a re-test of the medium-term green rising support line in the coming days. However, in our opinion, further deterioration will be more likely and reliable if the commodity closes the day under this key support line (in this case, we’ll consider opening short positions).
Before we summarize today’s alert, let’s take a closer look at the non-USD (WTIC:UDN ratio) chart of crude oil. As a reminder, UDN is the symbol for the PowerShares DB US Dollar Index Bearish Fund, which moves in the exact opposite direction to the USD Index. Since the USD Index is a weighted average of the dollar's exchange rates with world's most important currencies, the WTIC:UDN ratio displays the value of crude oil priced in "other currencies".
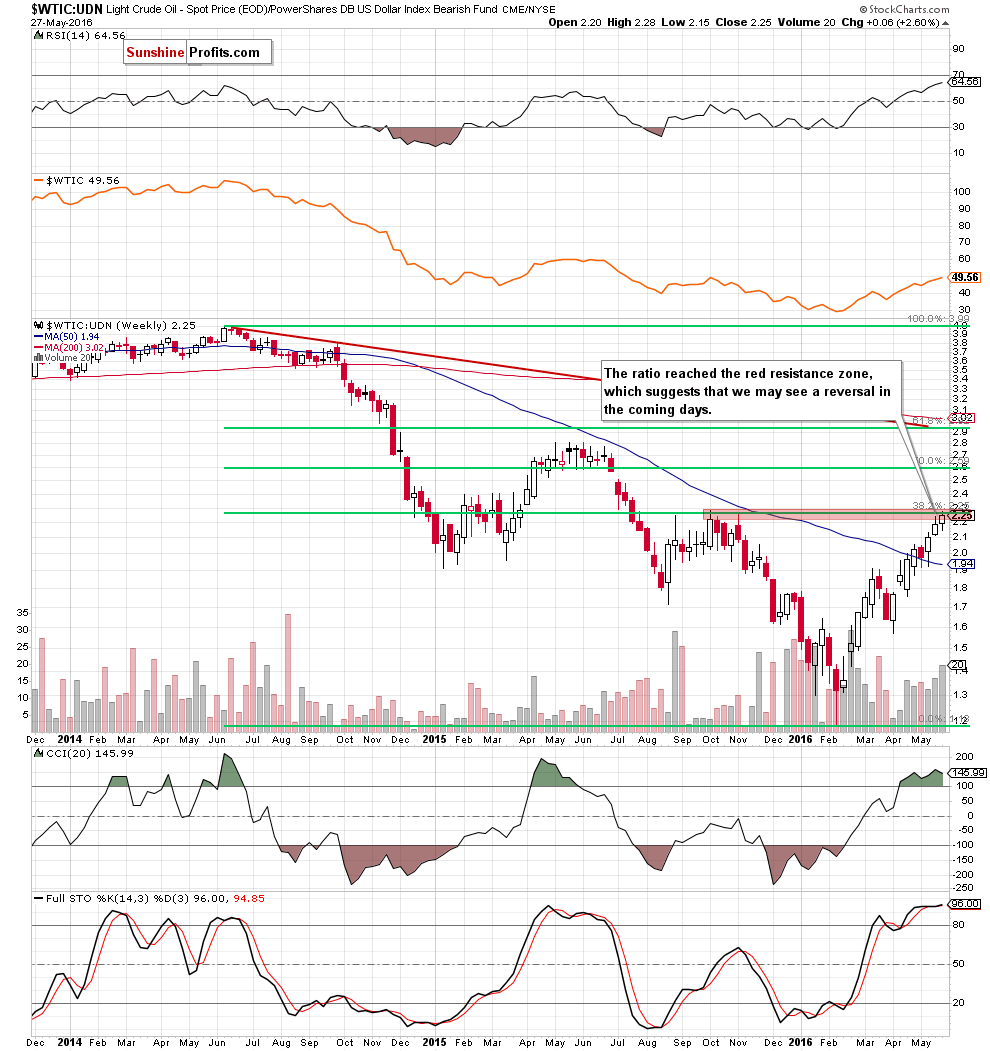
Looking at the weekly chart, we see that the ratio extended gains in the previous week and reached the red resistance zone (created by the Oct and Nov highs and the 38.2% Fibonacci retracement based on the entire Jun 2014-Feb 2016 downward move), which may stop further rally in the coming week. If this is the case, and the ratio reverses from here, well also see lower prices of crude oil in the following days.
Summing up, although crude oil rebounded slightly on Friday, the commodity closed the previous week under the barrier of $50 and the black resistance line based on the Mar and Apr highs, which means that invalidation of earlier small breakouts above these levels and its negative impact on the price is still in effect, suggesting further deterioration in the coming day(s).
Very short-term outlook: mixed with bearish bias
Short-term outlook: mixed
MT outlook: mixed
LT outlook: mixed
Trading position (short-term; our opinion): No positions are justified from the risk/reward perspective. We will keep you – our subscribers – informed should anything change.
On an administrative note, due to my travel plans, there will be no Oil Trading Alerts to the end of the week (the next Oil Trading Alert is scheduled for Monday, Jun 6). Nevertheless, if the situation changes significantly, we will send you a quick note with our latest analysis and thoughts on that matter.
Thank you.
Nadia Simmons
Forex & Oil Trading Strategist
Przemyslaw Radomski, CFA
Founder, Editor-in-chief
Gold & Silver Trading Alerts
Forex Trading Alerts
Oil Investment Updates
Oil Trading Alerts

