
On Tuesday, crude oil gained 0.50% as better-than-expected U.S. economic data pushed the price higher. Thanks to this, light crude erased Monday’s losses and came back above $99 per barrel.
On that day, the U.S. Commerce Department said that orders for durable goods rose by 3.5% last month beating economists' expectations. Meanwhile, new-home sales hit a seasonally adjusted annual rate of 464,000 last month, down only 2.1% from October's upwardly revised annual rate of 474,000. Sales have been the strongest over a two-month period since mid-2008, during the recession. These encouraging data bode well for crude demand in the world's largest oil consumer.
Also on Tuesday, after markets closed, the American Petroleum Institute, said that U.S. crude inventories rose by 500,000 barrels in the week ended December 20. A rise in inventory is bearish for crude oil, but the API data is not n tune with market expectations of a drop in weekly oil stockpiles. Please note that U.S. oil stocks are expected to have declined by 2.2 million barrels last week. As a reminder, widely watched supply and demand figures from the federal Energy Information Administration haves been delayed until Friday by the holiday.
Having discussed the above, let’s move on to the technical changes in the crude oil market (charts courtesy of http://stockcharts.com).
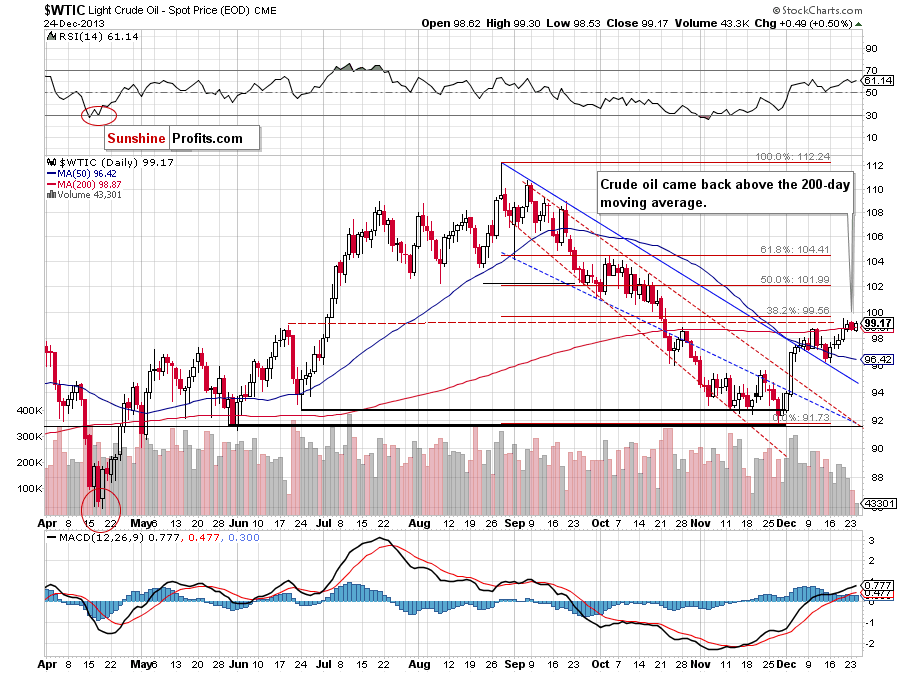
The most important improvement on the above chart is an upswing, which pushed crude oil above the 200-day moving average once again. However, it materialized on small volume, which is not as bullish as it seems at first sight.
Looking at the above chart, we clearly see that recent days have formed a consolidation slightly below the monthly high. If oil bulls do not give up and invalidate a bearish engulfing pattern we will likely see an upswing to the 38.2% Fibonacci retracement level (at $99.56) or even to the psychological barrier of $100. On the other hand, the proximity to these important resistance levels may trigger a pause or pullback, which should not surprise us – especially after the recent rally.
Please note that the nearest support is around $97.26, where the Dec.17 low is. The next is the 50-day moving average (currently at $96.42).
Once we know the above, let’s take a look at the NYSE Arca Oil Index (XOI) chart.
Looking at the above chart, we see that the situation hasn’t changed much and what we wrote in our previous Oil Trading Alert remains up-to-date also today.
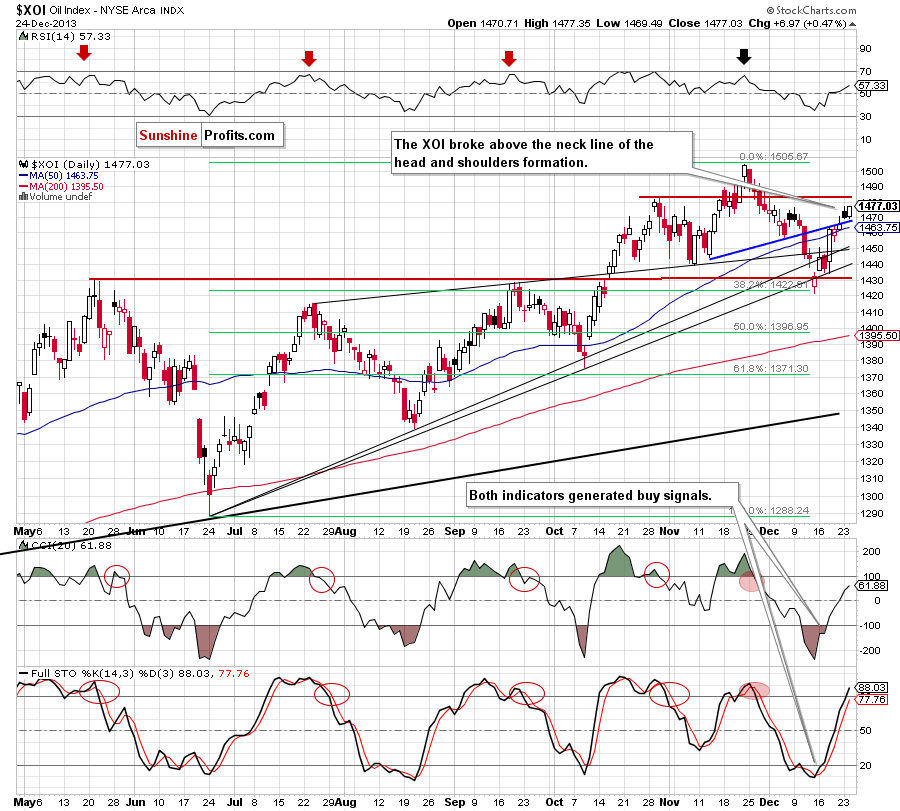
(…) the oil stock index extended its gains and broke above the neck line of the head and shoulders formation. With this upswing, the XOI also came back above the upper line of the medium-term rising wedge, which is a bullish sign. As you can see on the above chart, the oil stock index reached its first upside target and climbed to slightly above the Dec. 9 high. If the buyers do not give up, we may see further improvement and the next target will be around 1,483. Please note that the nearest support is the upper line of the medium-term rising wedge (currently around 1,466).
Summing up, crude oil moved higher and came back above the 200-day moving average, which is a positive sign for oil bulls. Although the proximity to resistance levels may trigger a pause or a pullback in the comming days the situation remains bullish.
Very short-term outlook: bullish
Short-term outlook: bullish
MT outlook: mixed with bullish bias
LT outlook: mixed
Trading position (short-term): Long. Stop-loss order for this position: $91.55. Stop-loss order for WTI Crude Oil (CFD): $91.30. We will keep you informed should anything change, or should we see a confirmation/invalidation of the above.
Thank you.
Nadia Simmons
Sunshine Profits' Crude Oil Expert
Oil Investment Updates
Oil Trading Alerts

