
On Friday, crude oil gained 0.37% on expectations that an improving U.S. economy could lead to increased oil demand. In this way, light crude closed the day above $99 and gained 2.73% in the previous week.
On that day, crude oil continued its rally on hopes for faster economic recovery, after data showed that the U.S. economy expanded more than expected in the third quarter. The day before, the Commerce Department reported that the U.S. gross domestic product expanded by 4.1% in the third quarter, well above forecasts for 3.6% growth. The revision was largely due to stronger consumer spending, which the department said grew at a 2% annual rate in the summer. Previously, the department had estimated consumer spending growth of 1.4%. These positive data fueled hopes that the country would demand more fuel and energy, which helped to keep the price around $99 per barrel.
Having discussed the above, let’s move on to the technical changes in the crude oil market (charts courtesy of http://stockcharts.com).
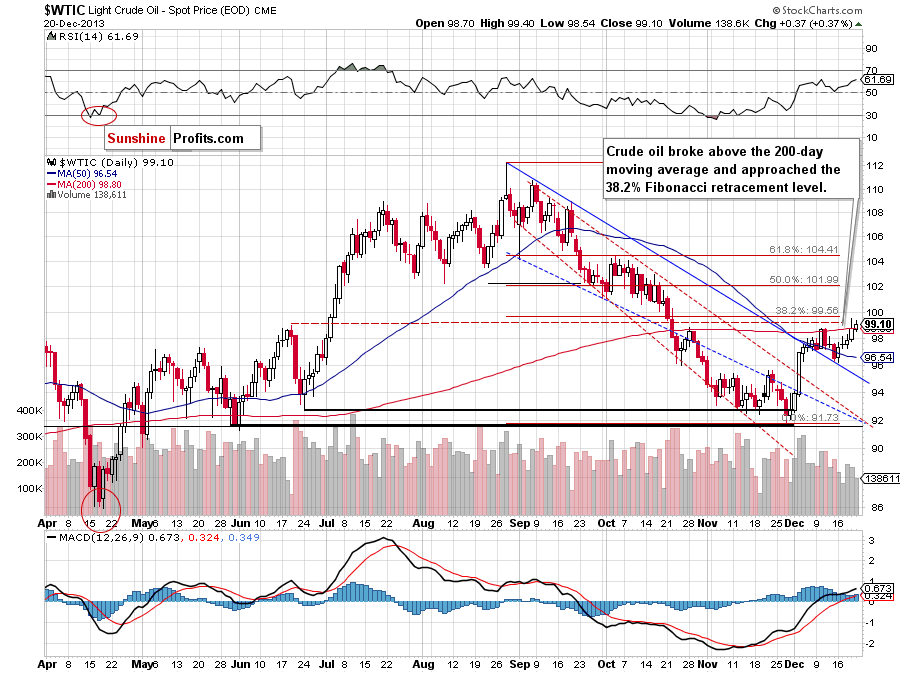
Looking at the above chart, we see that the situation hasn’t changed much. Although we saw a small drop below the 200-day moving average on Friday, crude oil quickly revesed course and closed the day above it. As you can see on the daily chart, light crude still remains below the 38.2% Fibonacci retracement level (at $99.56). Taking into account this resistance level and the psychological barrier of $100, a pause or a pullback should not surprise us. However, if oil bulls manage to successfully break above this strong resistance zone, the next upside target will be around $102 where the 50% Fibonacci retracement level is.
Please note that the nearest support is around $97.26, where the Tuesday low is. The next is the 50-day moving average (currently at $96.63).
Having discussed the current situation in crude oil, let’s take a look at WTI Crude Oil (the CFD).
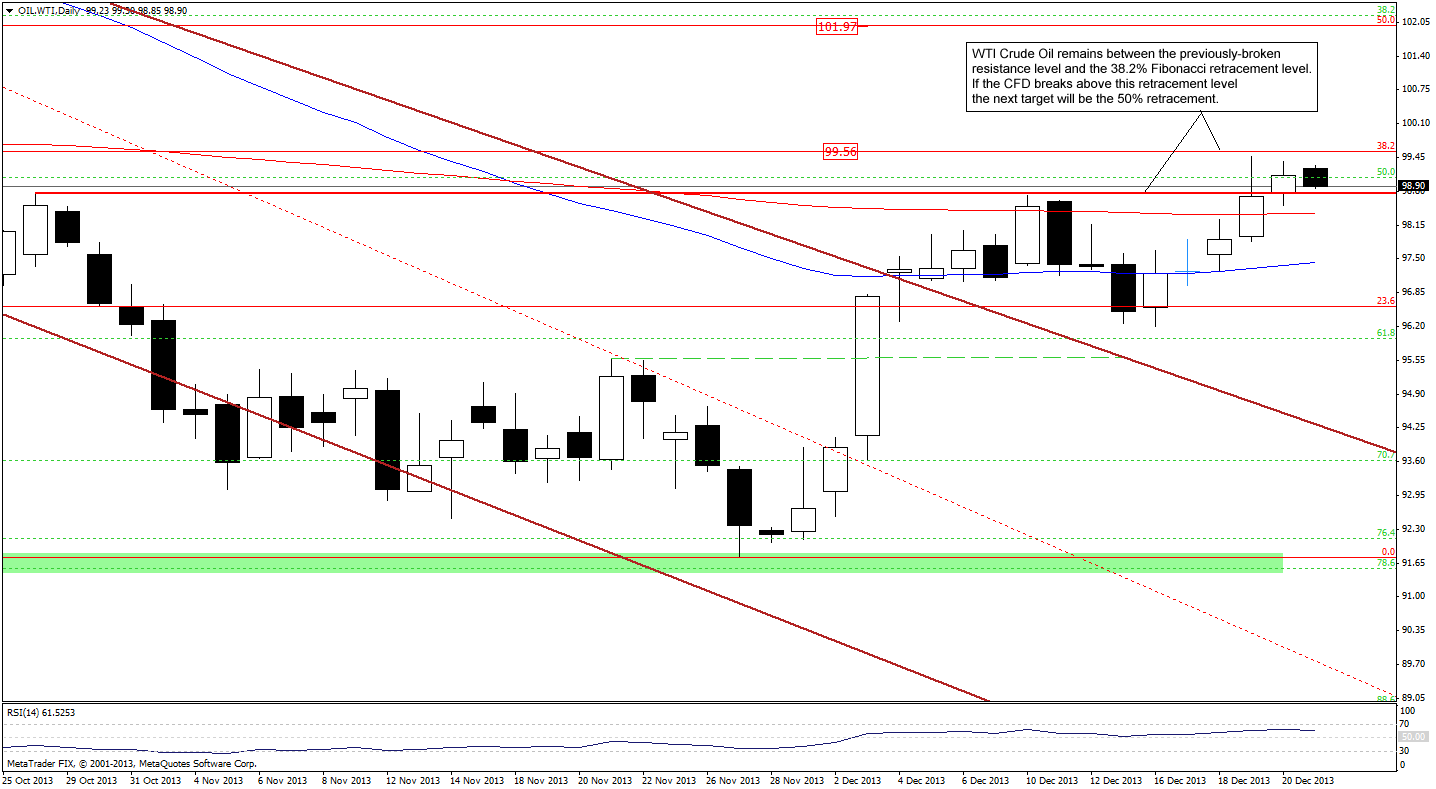
On the above chart, we see that despite a little drop, WTI Crude Oil remains in a narrow range between the previous high and the 38.2% Fibonacci retracement level. Therefore, what we wrote in our last Oil Trading Alert is still up to date.
(...) similarly to what we wrote in case of crude oil, if this resistance is broken, the upside target will be the 50% Fibonacci retracement level (around $102). Please note that the RSI is not overbought at the moment and it still has some room for further growth, which supports the bullish case.
However, if the CFD invalidates the breakout above the resistance level (and the previous high) we will likely see a pullback to the 200-day moving average, which serves as nearest support.
Please note that our last week’s assumption remains up to date: “(…) taking into account the fact that crude oil and WTI Crude Oil move together in the same direction, it seems that a move in the CFD will trigger a similar move in light crude.”
Once we know the above, let’s take a look at the NYSE Arca Oil Index (XOI) weekly chart.
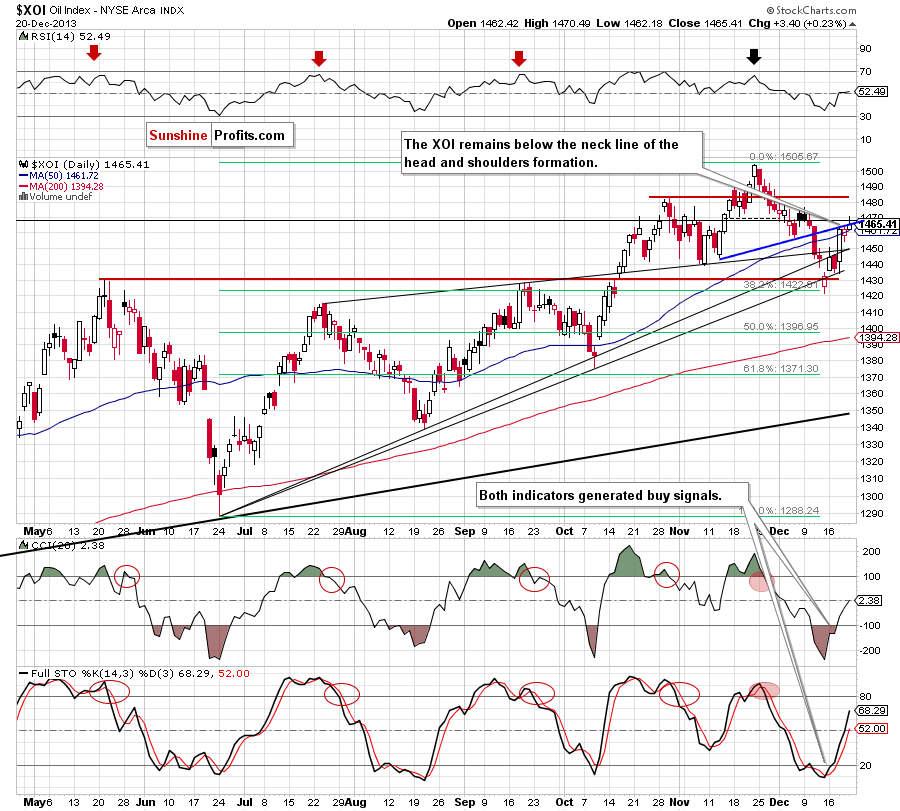
Looking at the above chart, we see that the situation hasn’t changed much. Although the oil stock index extended its gains, it still remains below the neck line of the head and shoulders formation and the upper line of the medium-term rising wedge. Therefore, what we wrote in our previous Oil Trading Alert remains up-to-date also today.
(...) we should keep in mind that this area (around 1,463) is reinforced by the upper line of the medium-term rising wedge (you can see this line more clearly on the weekly chart right here). Therefore, a pause or pullback should not surprise us. If the XOI breaks above this major medium-term resistance, we will likely see an upswing to at least 1,476 or even to 1,483 where the previously 2013 high is.
(…) please note that the CCI and Stochastic Oscillator generated buy signals, which supports further improvement in the near future.
Summing up, after the breakout above the 200-day moving average, crude oil remains near its seven-week high – still below its strong resistance created by the 38.2% Fibonacci retracement level and the psychological barrier of $100. Taking these circumstances into account, a pause or a pullback should not surprise us but the situation remains bullish.
Very short-term outlook: bullish
Short-term outlook: bullish
MT outlook: mixed with bullish bias
LT outlook: mixed
Trading position (short-term): Long. Stop-loss order for this position: $91.55. Stop-loss order for WTI Crude Oil (CFD): $91.30. We will keep you informed should anything change, or should we see a confirmation/invalidation of the above.
Thank you.
Nadia Simmons
Sunshine Profits' Crude Oil Expert
Oil Investment Updates
Oil Trading Alerts

