
On Thursday, crude oil was trading in a narrow range after mixed economic data. Light crude rose after better-than-expected U.S. retail sales, but gave up the gains as uncertainty over whether the U.S. Federal Reserve may begin to withdraw its stimulus program weighted on price.
Yesterday, the Commerce Department reported that U.S. retail sales rose 0.7% in November, beating market expectations for a 0.6% increase. Additionally, core retail sales, which are stripped of automobiles, rose 0.4%, above forecasts for a 0.2% increase. On the other hand, the Department of Labor said that the number of people who filed for unemployment assistance in the U.S. last week rose to a two month high of 368,000, compared to expectations for an increase to 320,000 from the previous week’s revised total of 300,000.
Looking at the shape of yesterday’s candlestick (doji), it seems that oil investors were confused and tried to puzzle out the impact of these mixed data. On the one hand, better-than-expected U.S. retail sales pushed the price of light crude higher on sentiments that the U.S. economy is gaining steam and will demand more fuel and energy going forward. On the other hand, the monetary implications of such improving data fueled expectations that the Federal Reserve will begin scaling back its $85 billion in monthly bond purchases sooner than expected and pushed the price lower.
Having discussed the above, let’s move on to the technical changes in the crude oil market (charts courtesy of http://stockcharts.com).
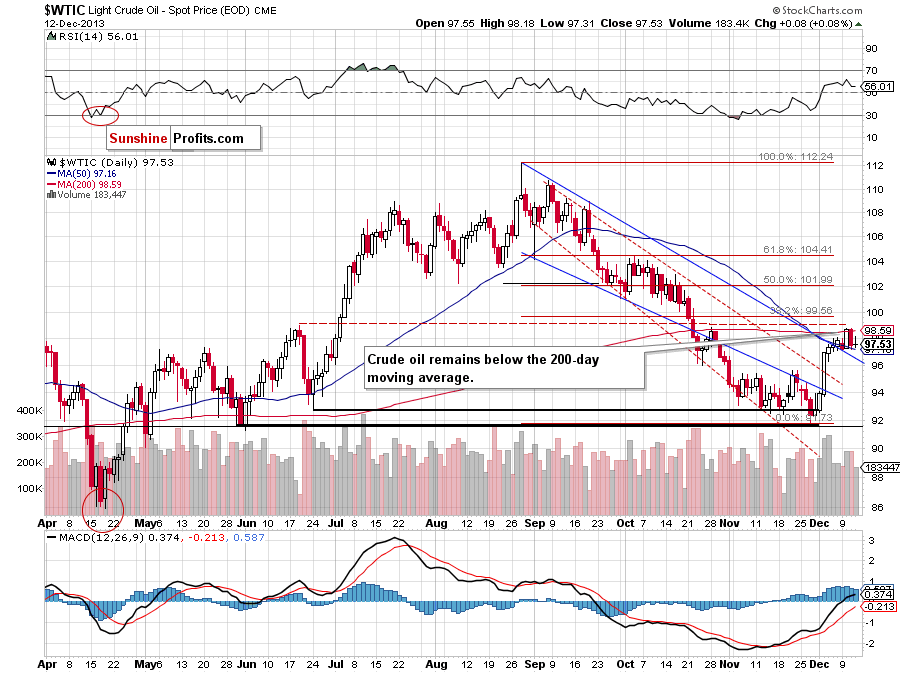
Looking at the above chart, we see that the situation didn’t change much yesterday. Although light crude rose after the market open, oil bulls didn’t push the price above the previously broken 200-day moving average, which still serves as major resistance. Nevertheless, oil bears also failed as they didn’t manage to break below the 50-day moving average (it still serves as support).
As you can see on the above chart, recent days have formed a consolidation. According to theory, if we see a breakout above $98.75, we will likely see further improvement and an upward move to around $100. However, if oil bears show their claws once again and take the price below $97.20, the downside price target will be around $95.65, which corresponds to the previously broken resistance level created by the Nov. 21 high. Please note that before the sellers realize their scenario, they will have to push crude oil below the upper line of the declining trend channel – currently around $96.40.
Having discussed the current situation in crude oil, let’s take a look at WTI Crude Oil (the CFD).
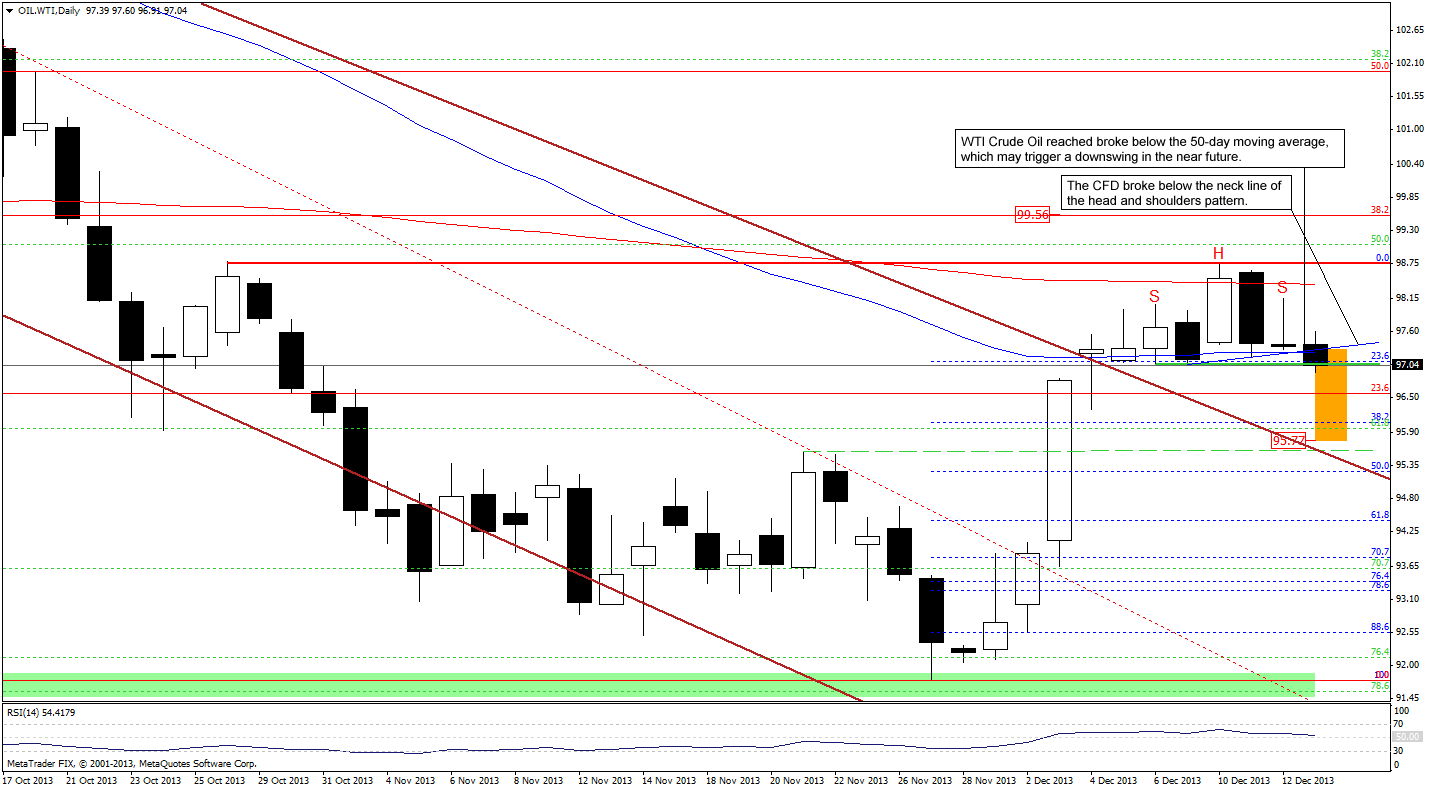
Looking at the above chart, we see that yesterday WTI Crude Oil was trading in a narrow range between the 200-day and 50-day moving average, which was in perfect tune with the price action that we saw in case of light crude.
Today, the CFD slipped below the 50-day moving average in early European trading, which will likely trigger a downswing to its first downside target around $96 where the 38.2% Fibonacci retracement (based on the entire recent rally) is.
However, when we take a closer look at the above chart, we can notice a small head and shoulders pattern. As you see, the price broke not only below the neck line (marked in blue), but also a support zone based on the Dec. 6 and Dec. 9 lows, which suggests further deterioration. In this case, the price target will be around $95.77.
Please note that our yesterday’s assumption remains up to date: “(…) taking into account the fact that crude oil and WTI Crude Oil move together in the same direction, it seems that a move in the CFD will trigger a similar move in light crude.”
Once we know the above, let’s take a look at the NYSE Arca Oil Index (XOI) weekly chart.
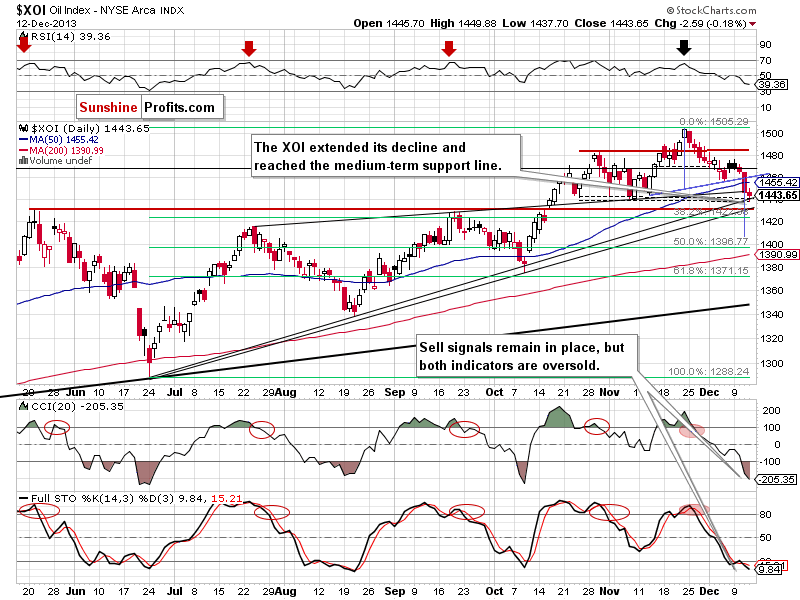
Looking at the above chart, we see that the situation deteriorated once again yesterday. After the market open, the XOI dropped below the upper line of the rising wedge, which encouraged sellers to act and resulted in a decline to slightly below the bottom of the correction that we saw at the beginning of November (at 1,439). At this point, it’s worth noting that this area is supported by the medium-term rising support line based on the June and August lows. As a reminder, this line successfully stopped further declines in early October. Therefore, if history repeats itself once again, we may see similar price action and oil stock will likely rebound in the coming days. Please note that yesterday the oil stock index reversed course and pulled back after reaching this line. Additionally, the CCI and Stochastic Oscillator are oversold (similarly to what we saw in early October), which reinforces the above assumption.
On the other hand, we should keep in mind what we wrote in yesterday’s Oil Trading Alert:
(…) when we take a closer look at the chart, we can notice a head and shoulders pattern. The yesterday drop pushed the XOI below the neck line (marked with blue), which may trigger further deterioration. According to theory, the price target for this formation will be around 1,410. Nevertheless, before the sellers realize their scenario, they will have to push the oil stock index below the support zone.
Taking the above into account, we should keep an eye on the XOI in the coming days because it seems that the oil stock index is currently at its critical juncture. Please note that the nearest major support zone is created by the May high, which intersects with the lower medium-term support line based on the June and October lows.
Summing up, after an invalidation of the breakout above the 200-day moving average, crude oil still remains above the 50-day moving average. Additionally, recent days have formed a consolidation. It seems that the next crude oil’s move will depend on the breakout or breakdown above/below the upper/lower line of the consolidation range. Keep in mind that the current corrective move is still shallow because and it hasn’t even erased 25% of the recent rally. Consequently, the situation remains bullish.
Very short-term outlook: bullish
Short-term outlook: bullish
MT outlook: mixed with bullish bias
LT outlook: mixed
Trading position (short-term): Long. Stop-loss order for this position: $91.55. Stop-loss order for WTI Crude Oil: $91.30. We will keep you informed should anything change, or should we see a confirmation/invalidation of the above.
Thank you.
Nadia Simmons
Sunshine Profits' Crude Oil Expert
Oil Investment Updates
Oil Trading Alerts

