

Trading position (short-term; our opinion): Short positions (with a stop-loss order at $54.15 and the initial downside target at $45.55) are justified from the risk/reward perspective.
Although the EIA showed a larger-than-expected drop in crude oil inventories, the black gold closed the day only 4 cents above Wednesday’s closure. Where are oil bulls?
Fundamental Factors and Crude Oil
Yesterday, the Energy Information Administration showed that crude oil inventories dropped 6.4 million barrels, exceeding the 4.4 million-barrel drop forecast. Additionally, gasoline inventories declined sharply (by 2.85 million barrels), easily beating analysts’ forecasts. Despite these bullish numbers the price of crude oil moved higher only temporary and the commodity erased earlier small gains very quickly, closing the day only 4 cents above Wednesday’s closure.
What does it mean for the black gold? In our opinion, the lack of response to the eighth straight week of crude oil inventories’ drop does not bode well for oil bulls – especially when we take into account a larger-than-expected drop in gasoline inventories. On top of that, rising output from Nigeria and Libya gave oil bears another reason to act. How all the above-mentioned factors affected the technical picture of light crude? Let’s check.
Crude Oil’s Technical Picture
Let’s take a closer look at the charts and find out what are they telling about future moves (charts courtesy of http://stockcharts.com).
Yesterday, we wrote the following:
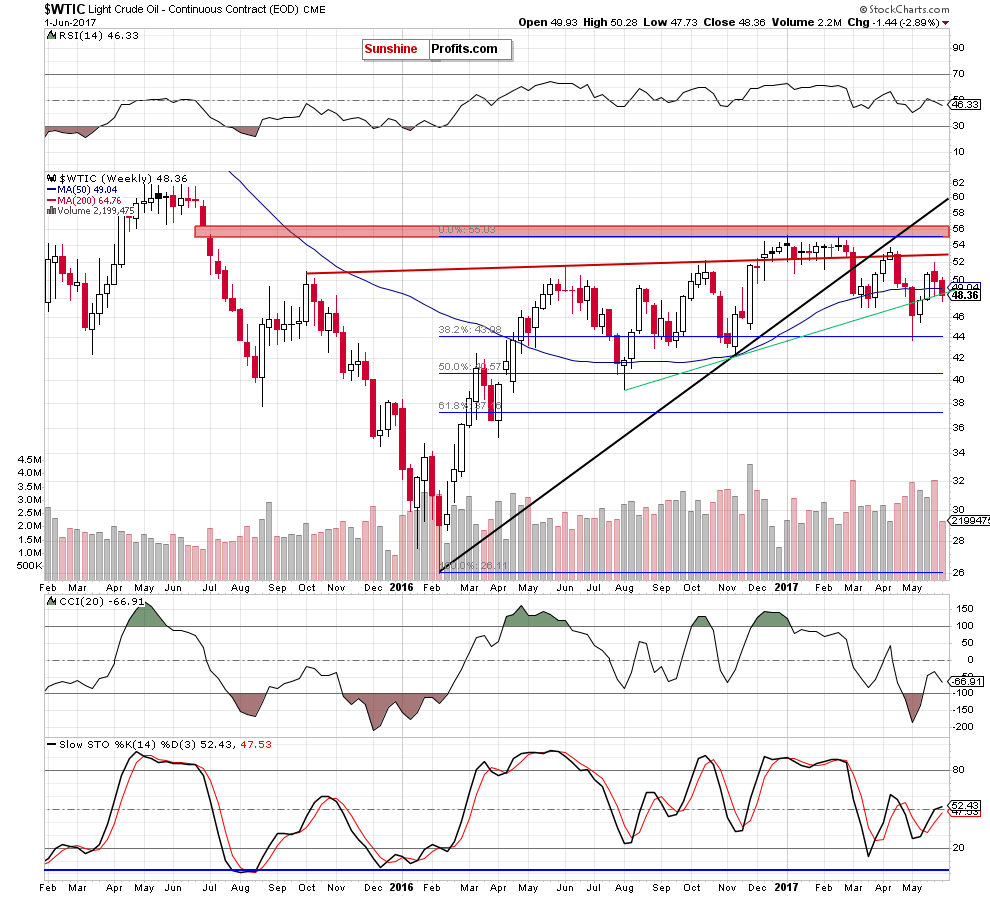
(…) we should keep in mind that yesterday’s decline took light crude to the 50% Fibonacci retracement, which could trigger a small rebound (to the long-term green support line based on the August and November lows) later in the day.
If we see such price action, it will be another negative event, which will suggest a verification of the earlier breakdown (…)
Looking at the above charts, we see that the situation developed in tune with our assumptions and crude oil verified the earlier breakdown under the long-term green support line based on the August and November lows. This negative development encouraged oil bears to act, which pushed the price of the commodity lower.
Although light crude closed yesterday’s session above Wednesday’s closure, it was another daily close below the previously-broken long-term green line (which serves as the nearest resistance at the moment), which increases the probability of further declines – especially when we factor in the lack of response to yesterday’s drops in crude oil and gasoline inventories.
Taking all the above into account, we believe that what we wrote yesterday remains up-to-date also today:
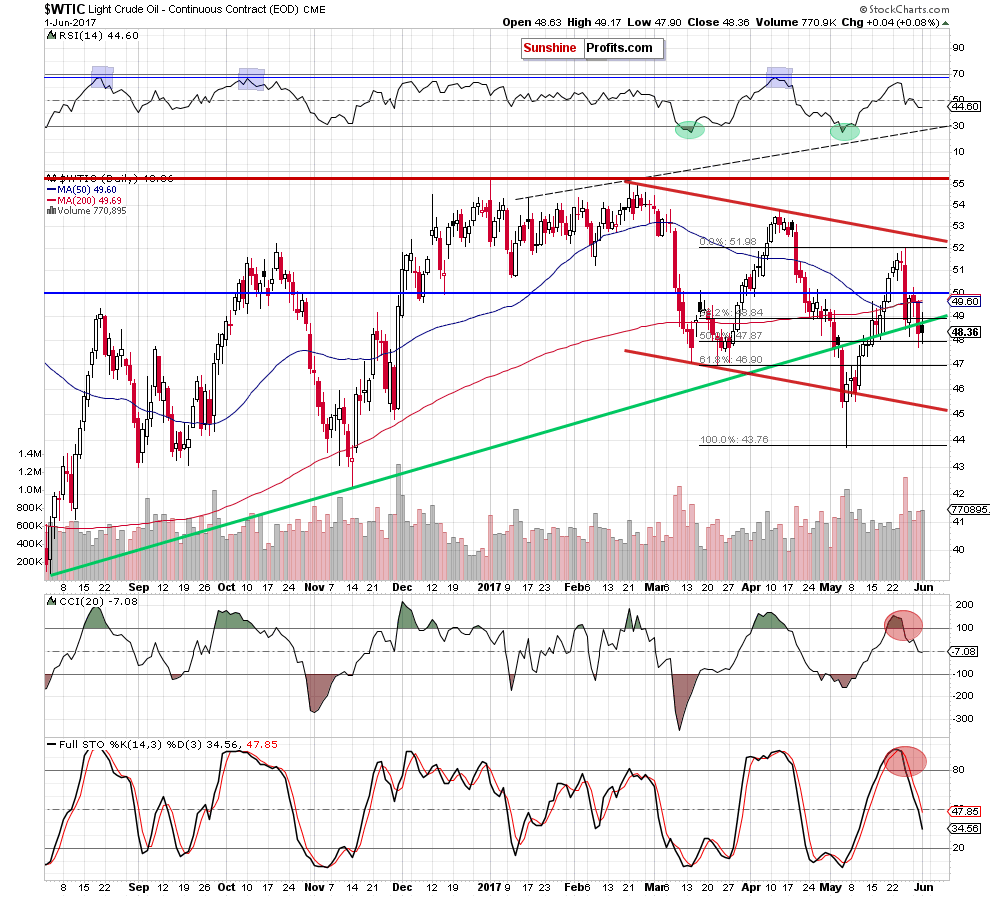
(…) crude oil not only slipped to the long-term green support line based on the August and November lows, but also closed the day below it, invalidating the earlier breakout. (…) the black gold also declined under the 50- and 200-day moving averages, which is an additional bearish development.
On top of that, the sell signals generated by the CCI and the Stochastic Oscillator remain in play, supporting oil bears and lower prices of the black gold.
(…) the first downside target will be the long-term green support line based on the August and November lows (currently around $48.53). If crude oil drops under this important support, the next target for oil bears will be around $45.55, where the previously-broken lower border of the red declining trend channel is.
And speaking about negative events… please take a look at the long-term chart below.
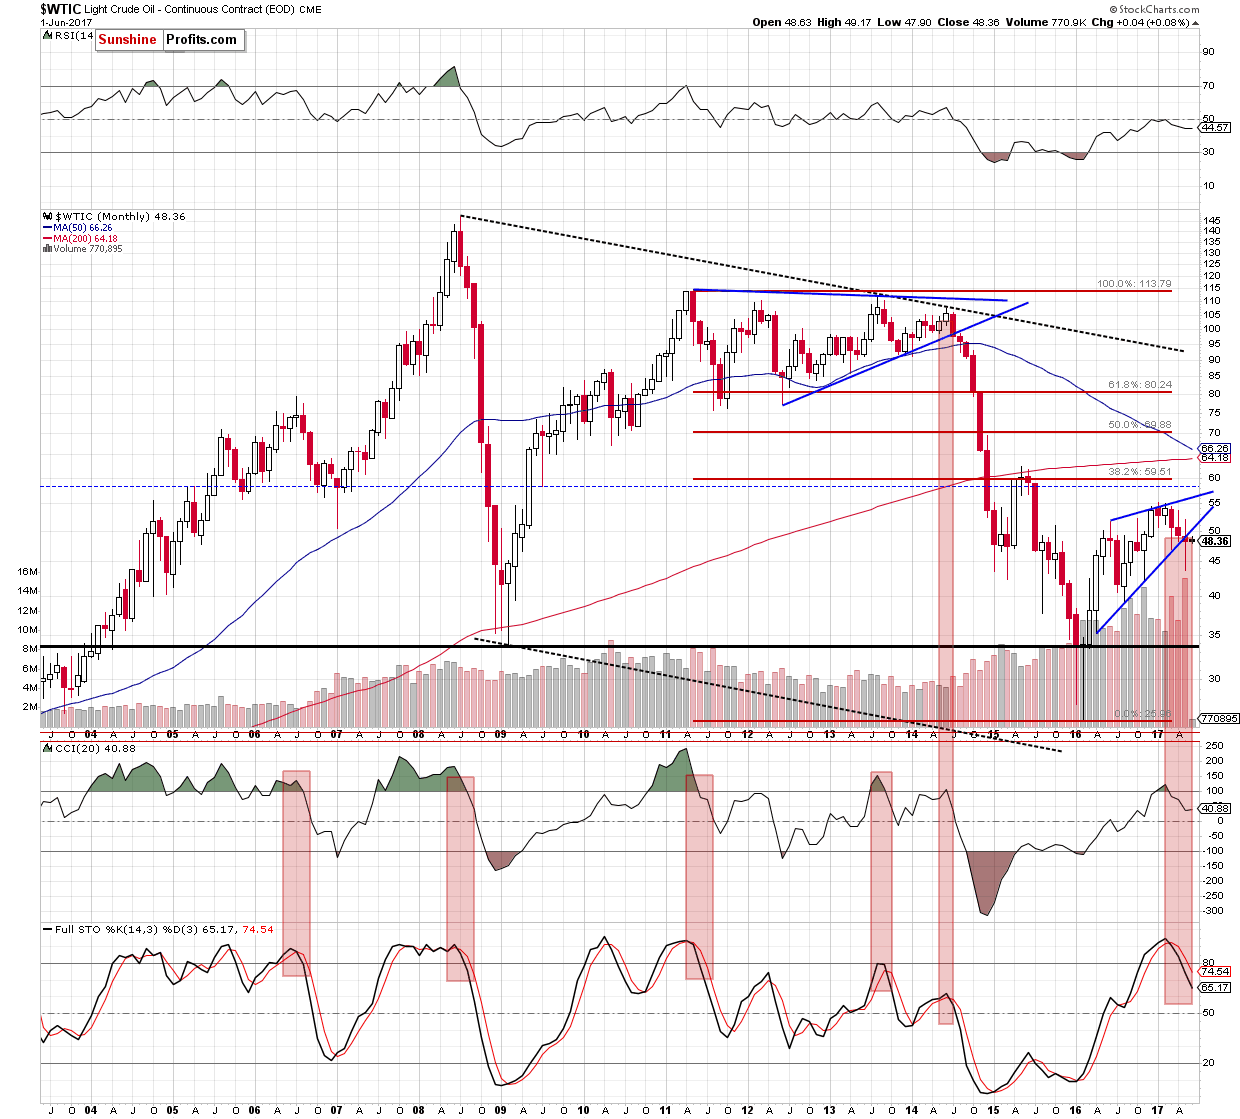
Looking at the monthly chart, we see that crude oil closed May under the previously-broken lower border of the rising wedge, which doesn’t bode well for oil bulls – especially when we factor in the sell signals generated by the indicators.
At this point, it is worth noting that the long-term sell signals together with the breakdown under the blue support line (the lower border of the blue triangle) preceded huge declines in 2014, which increases the probability of further deterioration in the coming weeks – even if we see a short-term (and short-lived) rebounds.
Summing up, short (already profitable) positions continue to be justified from the risk/reward perspective as crude oil closed another day under the long-term green support line based on the August and November lows and the previously-broken lower border of the rising wedge marked on the monthly chart. Additionally, an invalidation of the breakout above two important moving averages and its negative impact on the price are still in effect, which together with the sell signals generated by the indicators suggest lower prices of the black gold in the coming days.
Very short-term outlook: bearish
Short-term outlook: mixed with bearish bias
MT outlook: mixed
LT outlook: mixed
Trading position (short-term; our opinion): Short positions (with a stop-loss order at $54.15 and the initial downside target at $45.55) are justified from the risk/reward perspective. We will keep you – our subscribers – informed should anything change.
As a reminder – “initial target price” means exactly that – an “initial” one, it’s not a price level at which we suggest closing positions. If this becomes the case (like it did in the previous trade) we will refer to these levels as levels of exit orders (exactly as we’ve done previously). Stop-loss levels, however, are naturally not “initial”, but something that, in our opinion, might be entered as an order.
Thank you.
Nadia Simmons
Forex & Oil Trading Strategist
Przemyslaw Radomski, CFA
Founder, Editor-in-chief, Gold & Silver Fund Manager
Gold & Silver Trading Alerts
Forex Trading Alerts
Oil Investment Updates
Oil Trading Alerts

