

Trading position (short-term; our opinion): No positions are justified from the risk/reward perspective.
On Tuesday, crude oil lost 0.39% and approached the previously-broken long-term line. Will we see a verification of the earlier breakout or further declines in the coming days?
Let’s take a closer look at the charts and find out (charts courtesy of http://stockcharts.com).

On the weekly chart, we see that crude oil moved lower, which pushed the commodity under the previously-broken 50-week moving average. As a result, light crude invalidated the earlier tiny breakout, which is a negative event. Nevertheless, in our opinion, it will be more reliable if crude oil closes the week under this moving average.
How yesterday’s drop affect the very short-term picture of the commodity? Let’s check.
Yesterday, we wrote the following:
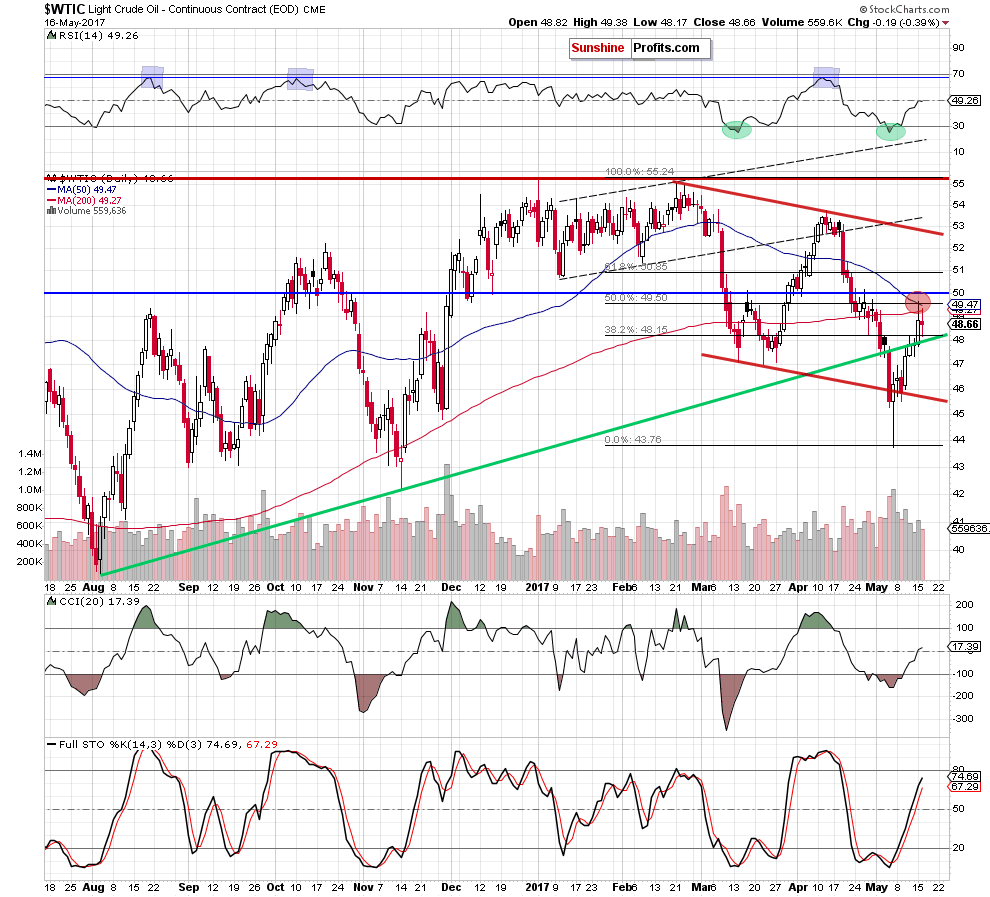
(…) the commodity climbed to the red resistance area (created by the 50% Fibonacci retracement based on the entire February-May downward move, the 50- and 200-day moving averages), which triggered a pullback. As a result, light crude invalidated the tiny breakout above the Fibonacci retracement, which suggests that another attempt to move lower may be just around the corner.
From today’s point of view, we see that the situation developed in line with the above scenario and oil bears pushed the black gold lower. As a result, light crude approached the previously-broken long-term green line, but then rebounded slightly and closed the day above it.
What’s next for the commodity? On one hand yesterday’s price action could look like a verification of the earlier breakout above the long-term green line. However, on the other hand, the red resistance area continues to keep gains in check. This suggests that as long as there is no breakout above this zone further rally is not likely to be seen and another downswing should not surprise us – especially when we factor in our yesterday’s commentary on the long-term picture of the commodity.

On the monthly chart, we see that the recent upswing approached crude oil to the previously-broken lower border of the blue rising wedge, which looks like a verification of the breakdown. Additionally, the sell signals generated by the long-term indicators remain in play, suggesting that lower prices of the black gold are still ahead us.
Finishing today’s alert, it’s worth noting that after yesterday’s market’s closure the American Petroleum Institute reported that although gasoline inventories fell more-than-expected, crude oil inventories increased by 882,000 barrels at the end of last week and missed expectations of a draw. Additionally, distillate stocks gained 1.79 million barrels also expectations of a 1.050 million barrels decline. If today’s government data confirms these disappointing numbers, oil bears will receive another reason to act later in the day.
Thank you.
Nadia Simmons
Forex & Oil Trading Strategist
Przemyslaw Radomski, CFA
Founder, Editor-in-chief, Gold & Silver Fund Manager
Gold & Silver Trading Alerts
Forex Trading Alerts
Oil Investment Updates
Oil Trading Alerts

