

Trading position (short-term; our opinion): Short positions (with a stop-loss order at $56.45 and an initial downside target at $45.81) are justified from the risk/reward perspective.
On Friday, crude oil moved a bit higher and closed another day above the barrier of $50. Is it enough to trigger further improvement?
Let’s examine the charts below to find out (charts courtesy of http://stockcharts.com).
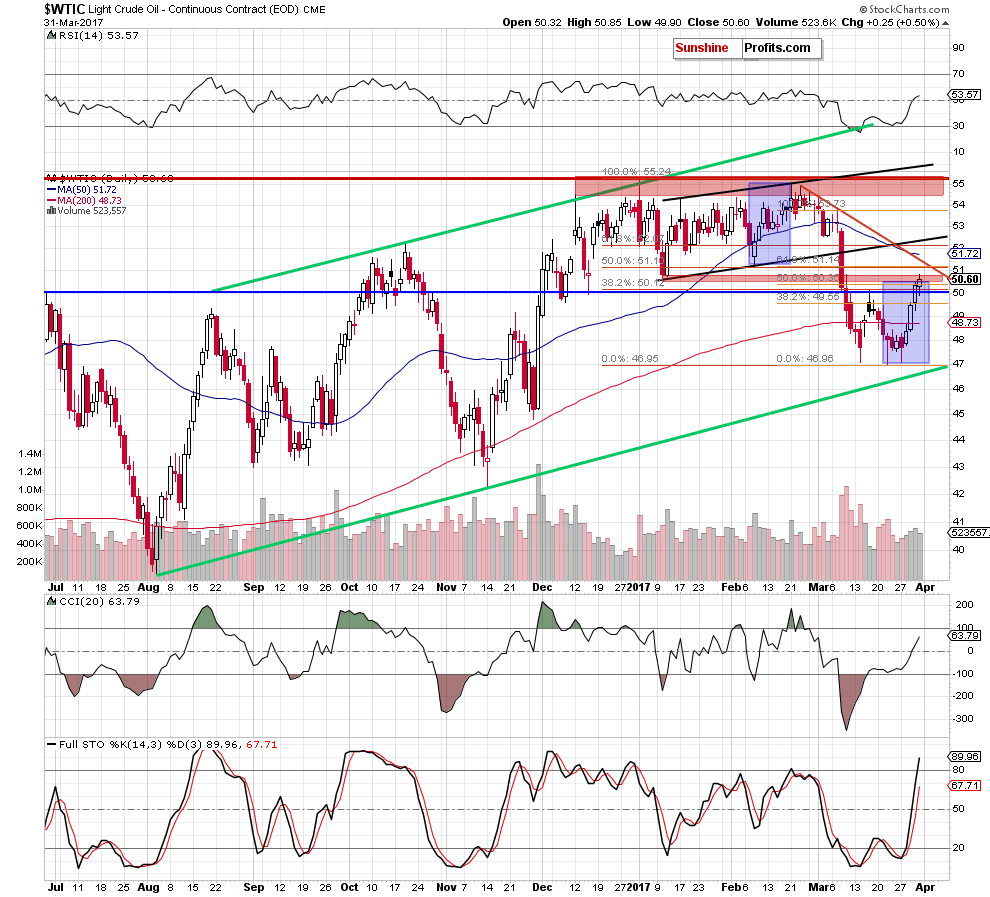
Looking at the daily chart, we see that crude oil increased slightly above the upper border of the red resistance zone, but then reversed and pulled back, invalidating this tiny breakout and closing the day below the January lows.
Additionally, not far from current levels (around $51.10-$51.14) is also a very strong resistance created by the 50% Fibonacci retracement based on the entire January – March downward move and the 61.8% retracement based on the March declines, which could encourage oil bears to act in the coming day(s). At this point, it is worth noting that similar combination of retracements stopped declines a week ago, which suggests that we may see similar reaction (but in opposite direction) in the very near future.
On top of that, when we take a closer look at the size of volume, which accompanied Friday’s increase, we’ll see it was smaller than day earlier, which may be the first signal suggesting that bulls are losing strength.
Finishing today’s alert, please keep in mind what we wrote on Friday:
(…) this week’s upward move is similar to the February’s rebound (both marked with blue rectangles), which means that oil bulls are not stronger than they were in the previous month at the moment of writing these words. This suggests that reversal and lower prices may be just around the corner – especially when we factor in the (…) red resistance zone.
(…) there are also interesting signs on the non-USD (WTIC:UDN ratio) charts of crude oil.
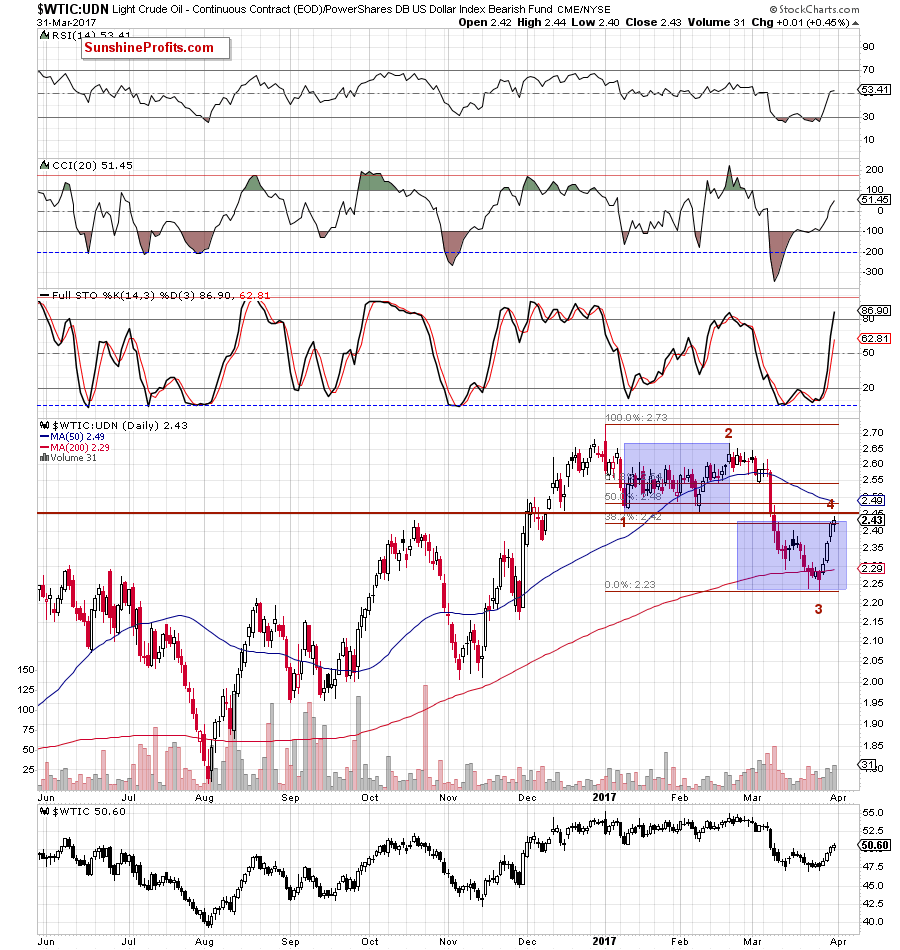
(…) this week’s increases took the ratio to the 38.2% Fibonacci retracement based on the entire 2017 downward move, which could trigger a pullback in the coming week. Additionally, similarly to what we saw in the case of crude oil priced in U.S. dollars, both upswings (the current and the one seen at the beginning of the year) are very similar, which increases the probability of reversal in a very near future.
On top of that, as long as there is no increase above the red horizontal resistance line (the bottom of the potential wave 1), the current move could be considered as the wave 4 in a 5-wave decline (according to the Elliot Wave Theory). If this is the case, and the ratio reverses and moves lower from here, we’ll see a fresh 2017 low not only in the ratio, but also in crude oil (or even another re-test of the recent lows and the green support line, which will be higher in the coming week).
Summing up, short positions continue to be justified as the picture, which emerges from the above charts suggests that another attempt to move lower may be just around the corner.
Very short-term outlook: bearish
Short-term outlook: mixed with bearish bias
MT outlook: mixed
LT outlook: mixed
Trading position (short-term; our opinion): Short positions (with a stop-loss order at $56.45 and an initial downside target at $45.81) are justified from the risk/reward perspective. We will keep you informed should anything change, or should we see a confirmation/invalidation of the above.
Thank you.
Nadia Simmons
Forex & Oil Trading Strategist
Przemyslaw Radomski, CFA
Founder, Editor-in-chief, Gold & Silver Fund Manager
Gold & Silver Trading Alerts
Forex Trading Alerts
Oil Investment Updates
Oil Trading Alerts

