

Trading position (short-term; our opinion): Short positions (with a stop-loss order at $53.22 and initial price target at $46) are justified from the risk/reward perspective.
On Monday, crude oil lost 0.65% as the Iraqi comments (the country wanted to be released from an OPEC freeze) and a stronger greenback weighed on investors’ sentiment. As a result, light crude slipped under the barrier of $50, but then rebounded and invalidated earlier breakdown. What does it mean for the commodity?
Let’s examine the charts below and find out (charts courtesy of http://stockcharts.com).
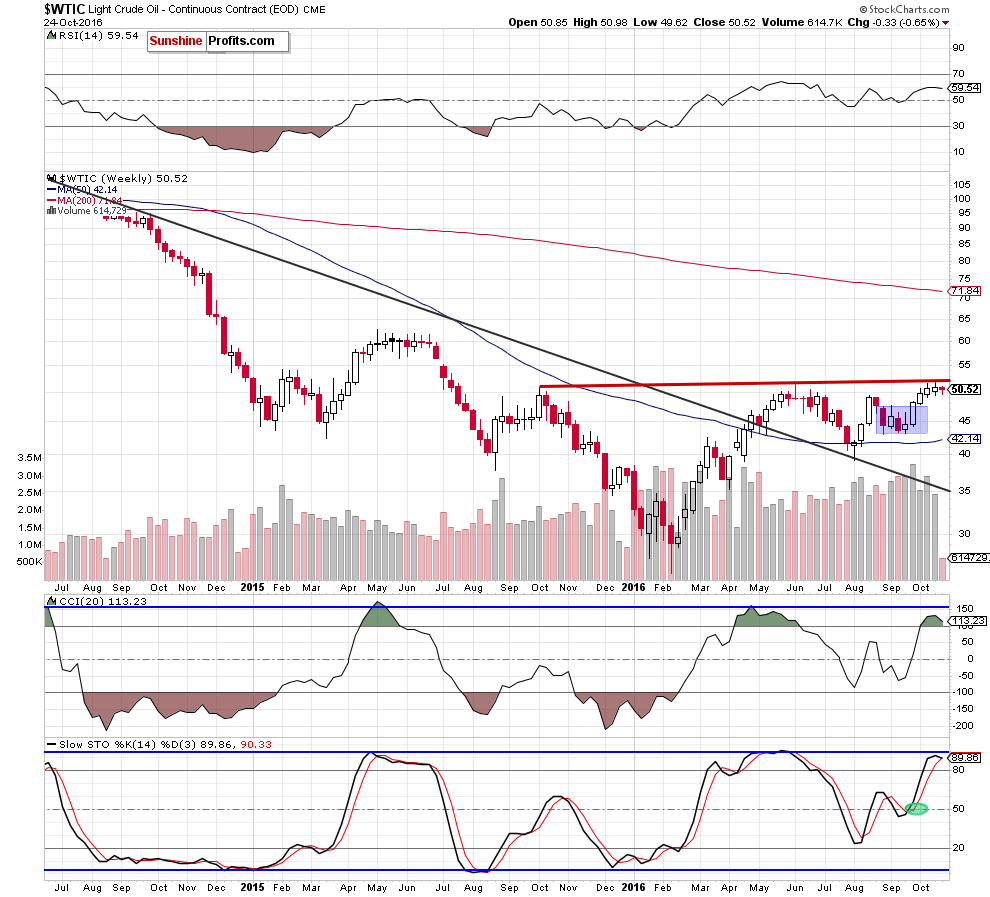
Looking at the weekly chart, we see that the red resistance line continues to keep gains in check. Additionally, the Stohastic Oscillator generated a sell signal (weak at this moment, but still), while the CCI is very close to doing the same. Which suggests that further deterioration is just around the corner.
Having said the above, let’s examine the situation in the very short term.
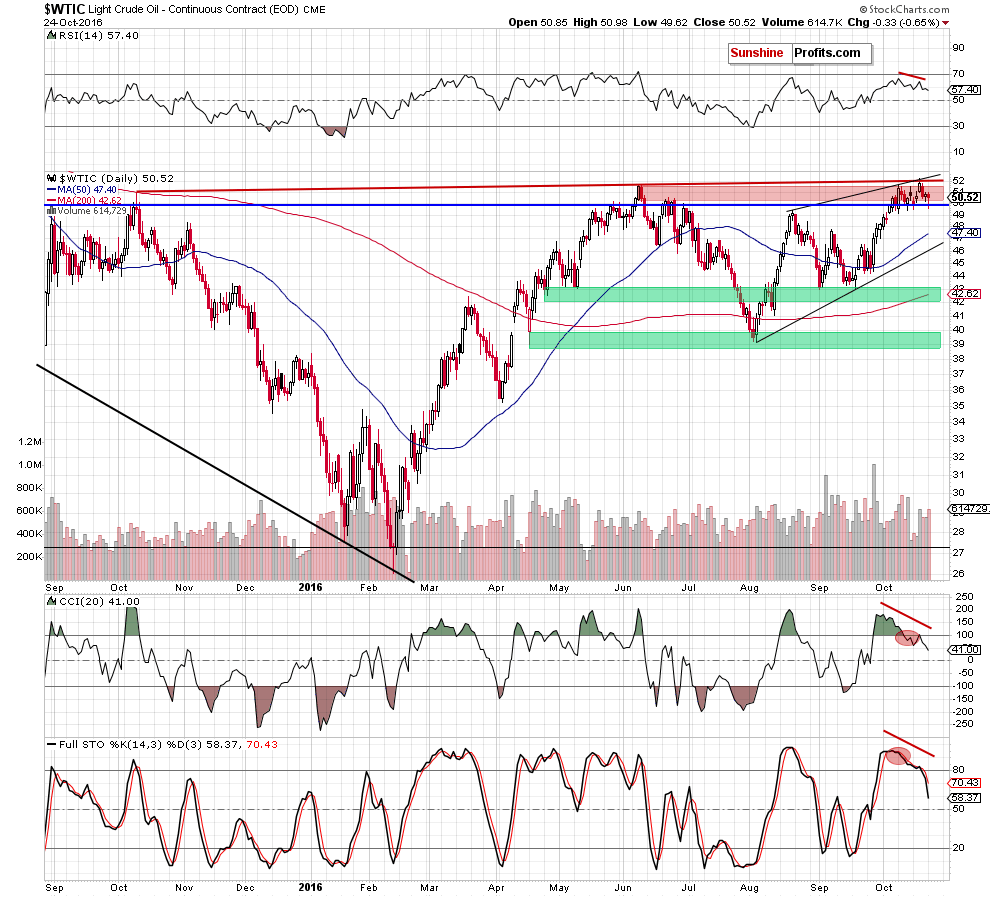
Yesterday, we wrote the following:
(...) the proximity to the barrier of $50 encouraged oil bulls to act, but the size of the move is tiny compared to Thursday’s decline. Additionally, an invalidation of earlier breakouts is still in effect, suggesting lower prices of the commodity (especially when we add sell signals generated by the daily indicators) (...) Therefore, another test of the barrier of $50 is more likely than not.
From today’s point of view, we see that the situation developed in line with our yesterday’s assumptions and oil bears pushed the comodity to an intraday low of $49.62. Despite this negative event, their opponents managed to stop declines and trigger a rebound, which took light crude above the barrier of $50.
What’s next? Although crude oil invalidated yesterday’s breakdown (which is a positive signal that suggests further improvement), we should keep in mind that sell signals generated by the daily indicators remain in play, supporting oil bears and lower prices of light crude. Additionally, the size of the volume that accompaned yesterday’s drop was bigger than what we saw on Friday during a small rebound, which suggests that oil bears are not as weak as it may looks at the first sight.
On top of that, the current situation in the oil-to-gold ratio still favors oil bears and further deterioration.
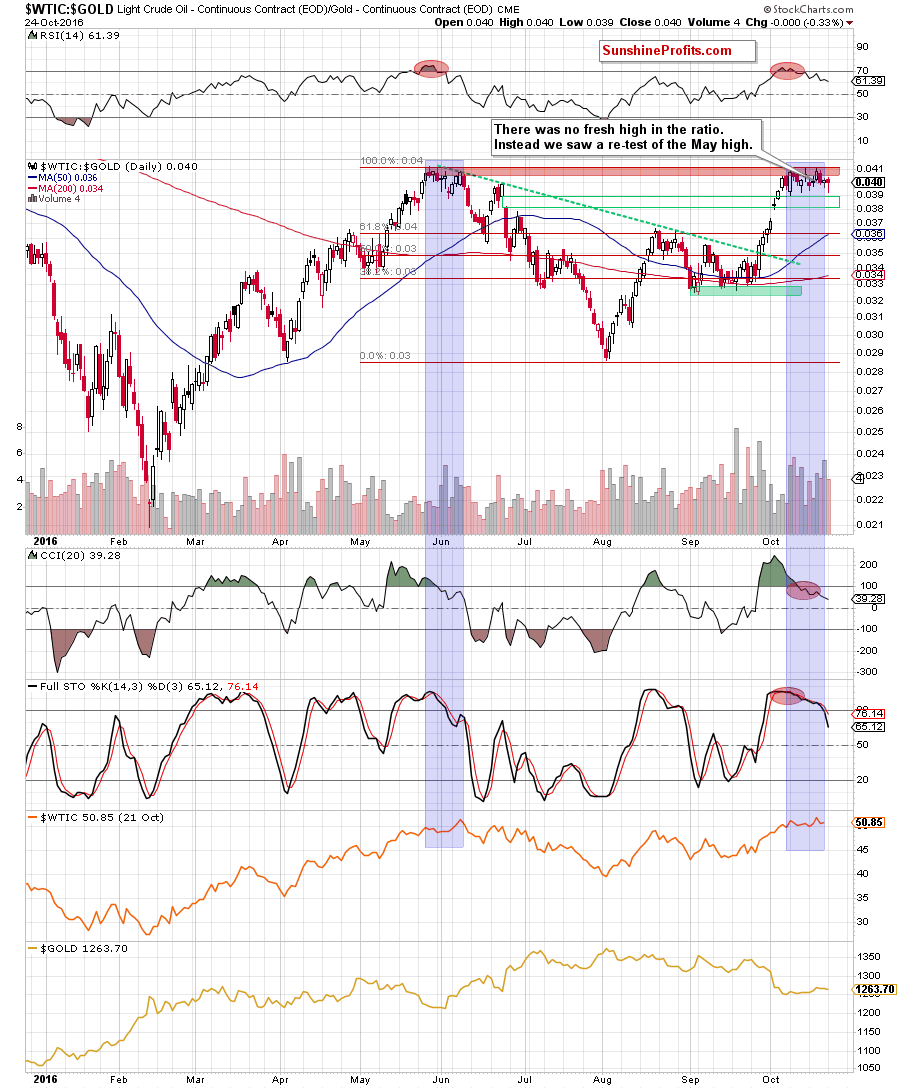
(...) although crude oil hit a fresh 2016 high, we didn’t see a similar price action in the case of the ratio. Instead, we saw a re-test of the May high, which means that we have a negative divegence between the commodity and the ratio.
What does it mean for crude oil’s future moves? As you see on the chart, we had a similar situation in May and Jun. Back then the ratio didn’t manage to hit a fresh high in line with crude oil, which translated into declines in both cases – crude oil and tthe ratio. Additionally, sell signals generated by the indicators remain in place, suggesting further deterioration in the ratio and lower prices of light crude as a strong negative correlation remains in place.
Finishing today’s alert, we decided to zoom out the above chart and exaine the medium-term picture.
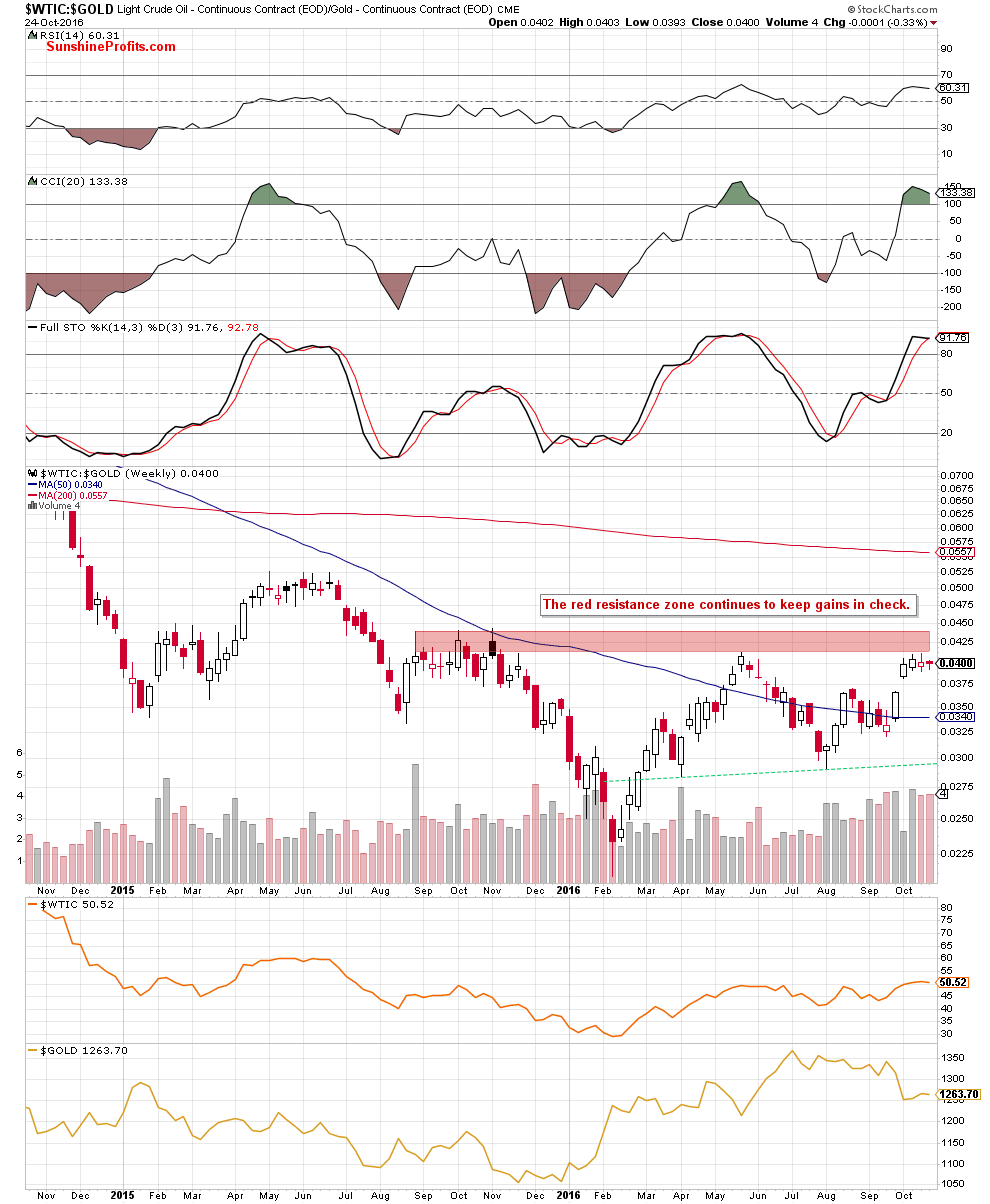
From this perspective, we see that the ratio is consolidating under the red resistance zone. However, when we take a closer look, we notice that the Stochastic Oscillator generated a sell signal, giving oil bears an additional factor to act.
Taking all the above into account, we believe that further deterioration in the above ratio and crude oil is just around the corner. Therefore, another test of the barrier of $50 is more likely than not. If this important support is broken, the next downside taget would be around $49.15-$49.47, where the recent lows are.
Summing up, short positions continue to be justified from the risk/reward perspective as invalidation of breakouts and its negative impact on the price is still in effect. Additionally, sell signals generated by the indicators (now not only daily, but also weekly) and the current situation in the above-mentioned ratio suggests further deterioration and a test of the first support area around $49.15-$49.47 in the coming day(s).
Very short-term outlook: bearish
Short-term outlook: mixed with bearish bias
MT outlook: bearish
LT outlook: mixed with bearish bias
Trading position (short-term; our opinion): Short positions (with a stop-loss order at $53.22 and initial downside target at $46) are justified from the risk/reward perspective. We will keep you informed should anything change, or should we see a confirmation/invalidation of the above.
As a reminder – “initial target price” means exactly that – an “initial” one, it’s not a price level at which we suggest closing positions. If this becomes the case (like it did in the previous trade) we will refer to these levels as levels of exit orders (exactly as we’ve done previously). Stop-loss levels, however, are naturally not “initial”, but something that, in our opinion, might be entered as an order.
Thank you.
Nadia Simmons
Forex & Oil Trading Strategist
Przemyslaw Radomski, CFA
Founder, Editor-in-chief, Gold & Silver Fund Manager
Gold & Silver Trading Alerts
Forex Trading Alerts
Oil Investment Updates
Oil Trading Alerts

