

Trading position (short-term; our opinion): No positions are justified from the risk/reward perspective.
On Monday, crude oil increased after Russian President Vladimir Putin said that his country was ready to join OPEC's proposal to cut oil production. Thanks to these circumstances, light crude invalidated earlier breakdown under the barrier of $50, which resulted in an increase to the Jun high. Will we see a double top or further rally in the coming days?
Let’s examine the charts below and try to find out what can we expect in the coming days (charts courtesy of http://stockcharts.com).
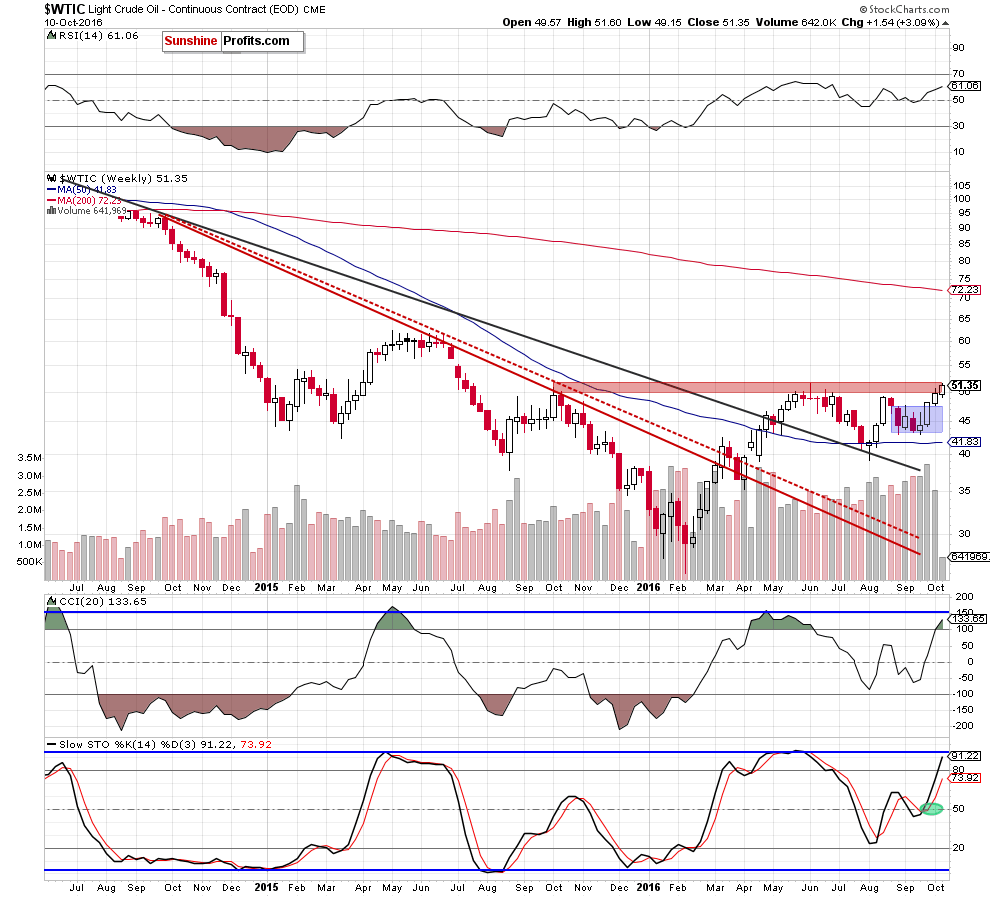
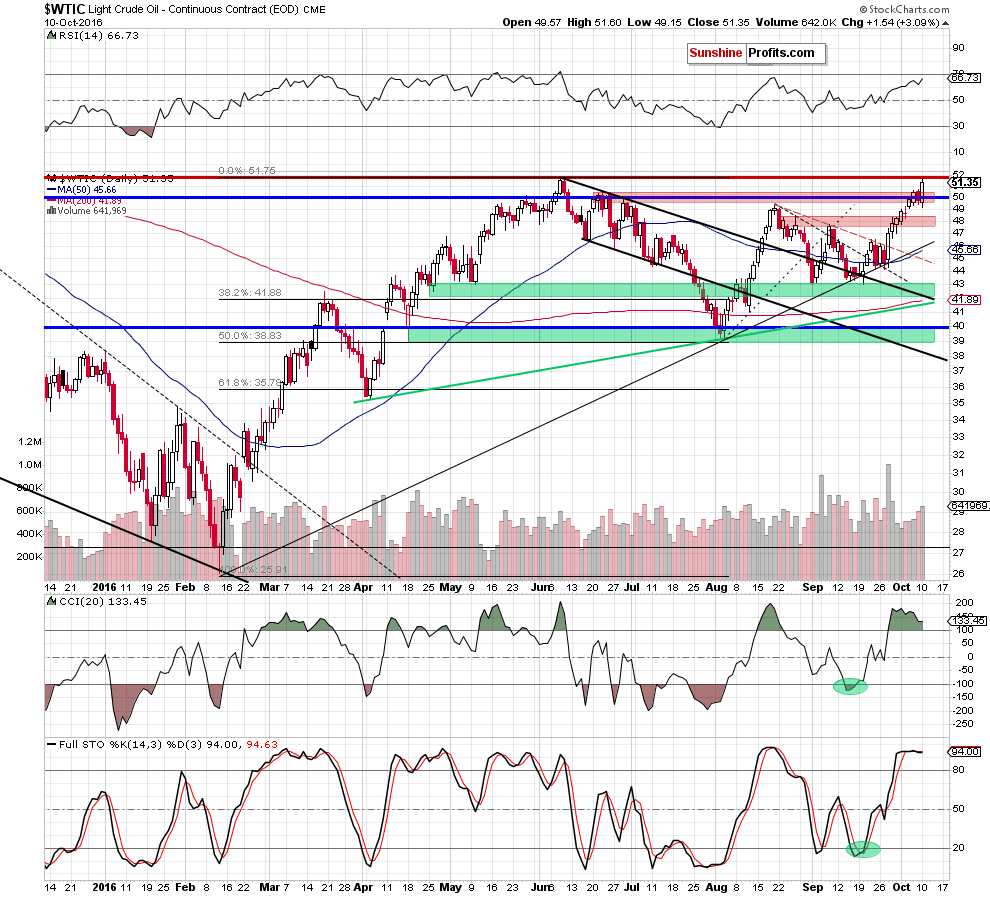
Looking at the above charts, we see that although crude oil moved lower after the markets open, oil bulls managed to stop their opponents, which resulted in a comeback above the barrier of $50. As you see, this positive event (an invalidation of a breakdown) triggered further improvement, which resulted in a rally to an intraday high of $51.60. In this way, the commodity almost touched the Jun high, which is also the upper border of the red key resistance zone marked on the weekly chart.
What’s next? We believe that as long as there won’t be a confirmed breakout above the Jun high a reversal and lower values of crude oil are very likely – especially when we factor in the fact that there are negative divergences (between the RSI CCI, Stochastic Oscillator and the price of the commodity) and a sell signal generated by the Stochastic Oscillator (not strong yet, but still).
Nevertheless, to have a more complete picture of the commodity, we decided to examine two of our ratios. What are they saying about future moves? Let’s start with the oil-to-oil stocks ratio.
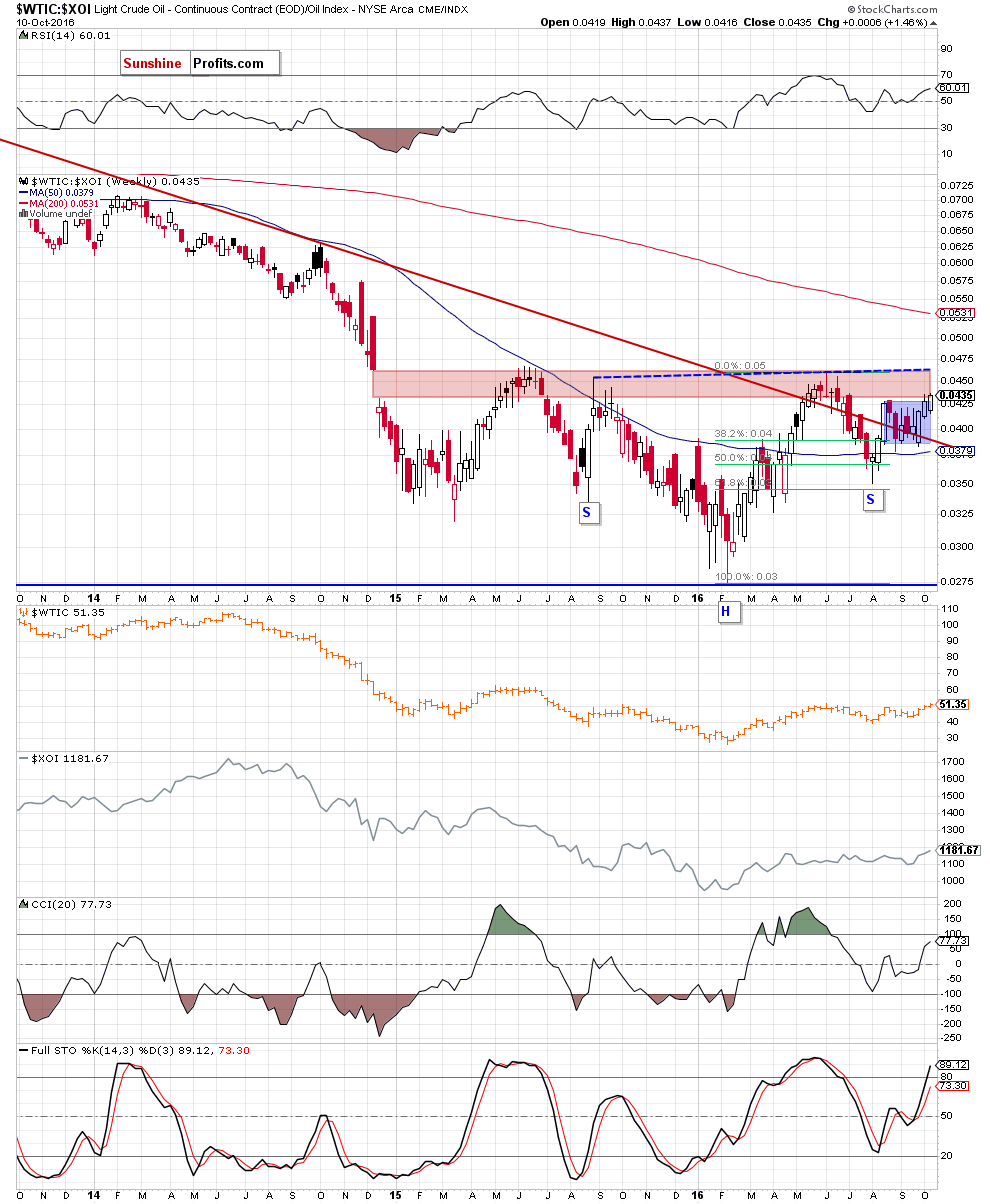
On the above chart, we see that although the ratio moved higher and broke above the upper border of the blue consolidation, the key red resistance zone (based on the Dec 2014 gap) continues to keep gains in check. Therefore, we think that even if the ratio increases slightly from here, as long as there won’t be a breakout and a weekly closure above the upper border of the zone (which is currently reinforced by the neck line of a potential reverse head and shoulders formation) further rally is not likely to be seen and another reversal is very likely (not only in the case of ratio, but also in the case of crude oil as strong positive relationship remains in play).
Finishing oday’s alert, we would like to take a closer look at the non-USD (WTIC:UDN ratio) chart of crude oil. As a reminder, UDN is the symbol for the PowerShares DB US Dollar Index Bearish Fund, which moves in the exact opposite direction to the USD Index. Since the USD Index is a weighted average of the dollar's exchange rates with world's most important currencies, the WTIC:UDN ratio displays the value of crude oil priced in "other currencies".
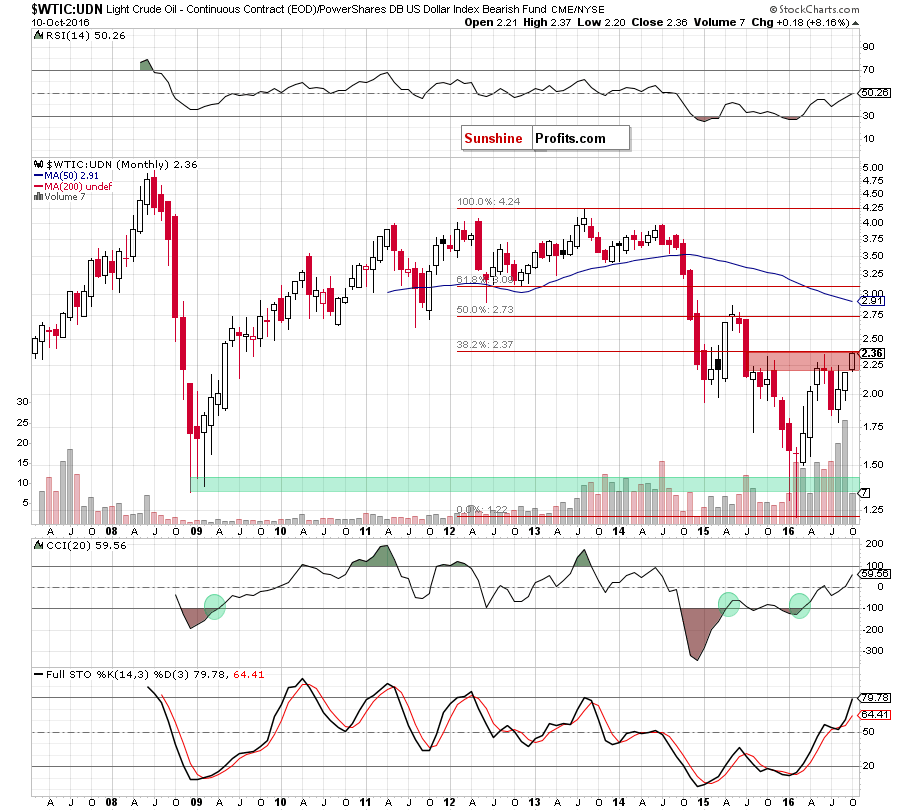
Looking at the above chart, we see that although the ratio extended gains and broke above the Jun high (the breakout is unconfirmed), the 38.2% Fibonacci retracement (based on the entire Aug 2013-Feb 2016 downward move) continues to keep gains in check. This suggests that only a confirmed breakout above this resistance would open the way to higher levels. Until this time, another reversal should not surprise us. If we see such price action, light crude (priced in the U.S. dollars) will also reverse and correct the recent upward move in near future.
Summing up, crude oil extended gains and almost touched the upper border of the key resistance zone - the Jun high of $51.67. Although this is a positive signal, a sell signal generated by the Stochastic Oscillator in combination with negative divergences between other indicators and the price of the commodity and the current picture of the oil market that emerges from our ratios suggests that the space for gains is limited and reversal is just around the corner.
Very short-term outlook: mixed with bearish bias
Short-term outlook: mixed
MT outlook: mixed
LT outlook: mixed
Trading position (short-term; our opinion): No positions are justified from the risk/reward perspective. We will keep you – our subscribers – informed should anything change.
Thank you.
Nadia Simmons
Forex & Oil Trading Strategist
Przemyslaw Radomski, CFA
Founder, Editor-in-chief, Gold & Silver Fund Manager
Gold & Silver Trading Alerts
Forex Trading Alerts
Oil Investment Updates
Oil Trading Alerts

