

Trading position (short-term; our opinion): Long positions (with a stop-loss order at $42.95 and initial upside target at $50) are currently justified from the risk/reward perspective.
On Monday, crude oil gained 3.26% on hopes that a freezing deal between major crude exporters will be reached. As a result, light crude bounced off support area and erased almost all Friday’s losses. What’s next?
Let’s focus on the daily chart and find out (charts courtesy of http://stockcharts.com).
Quoting our previous alert:
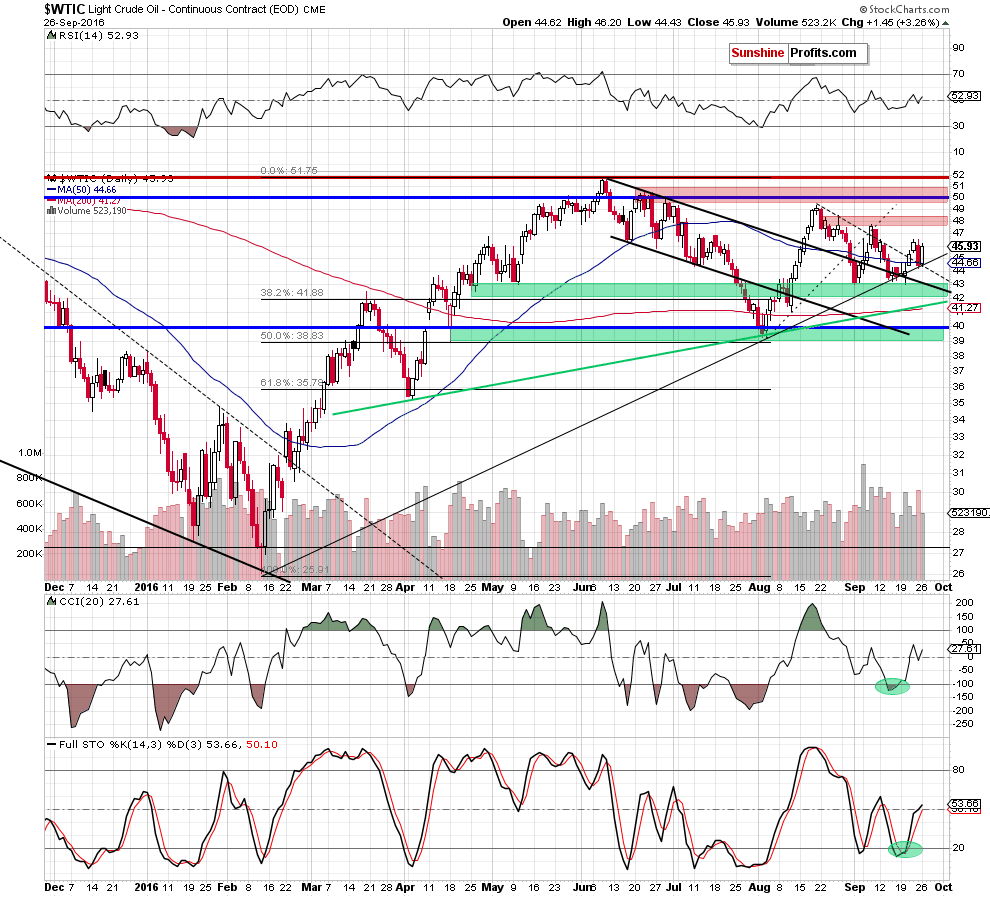
(…) light crude slipped to the previously-broken levels: the black dashed line (based on the Aug highs), the 50-day moving average and the black rising support line based on the Feb and Aug lows, which looks like a verification of earlier breakouts. If this is the case, crude oil will rebound and reach one of our upside targets in the coming days.
From today’s point of view, we see that the situation developed in line with the above scenario and crude oil increased yesterday. With this upswing, the commodity erased most of Friday’s losses, which in combination with buy signals generated by the indicators suggests further improvement. How high could the commodity go? We think that the best answer to this question will be the quote from our Thursday’s alert:
(…) the initial upside target would be the red resistance zone, which stopped oil bulls at the beginning of the month (around $47.75-$48.46). If it is broke, we may see a test of the barrier of $50 in the coming week.
Nevertheless, before we summarize today’s alert, we would like to draw your attention to the size of volume that accompanied yesterday’s session. As you see it was quite tiny (compared to what we saw on Friday), which suggests that we may see a re-test of the above-mentioned support zone (created by the black dashed line based on the Aug highs, the 50-day moving average and the black rising support line based on the Feb and Aug lows) before light crude climb higher.
Summing up, crude oil verified breakouts above the black dashed line (based on the Aug highs), the 50-day moving average and the black rising support line based on the Feb and Aug lows, which suggests further improvement. However, before we see such price action a re-test of these levels should not surprise us.
Very short-term outlook: bullish
Short-term outlook: mixed with bullish bias
MT outlook: bullish
LT outlook: mixed
Trading position (short-term; our opinion): Long positions (with a stop-loss order at $42.95 and initial upside target at $50) are currently justified from the risk/reward perspective. We will keep you informed should anything change, or should we see a confirmation/invalidation of the above.
As a reminder – “initial target price” means exactly that – an “initial” one, it’s not a price level at which we suggest closing positions. If this becomes the case (like it did in the previous trade) we will refer to these levels as levels of exit orders (exactly as we’ve done previously). Stop-loss levels, however, are naturally not “initial”, but something that, in our opinion, might be entered as an order.
Thank you.
Nadia Simmons
Forex & Oil Trading Strategist
Przemyslaw Radomski, CFA
Founder, Editor-in-chief, Gold & Silver Fund Manager
Gold & Silver Trading Alerts
Forex Trading Alerts
Oil Investment Updates
Oil Trading Alerts

