

Trading position (short-term; our opinion): No positions are justified from the risk/reward perspective.
On Tuesday, crude oil lost 3% as the International Energy Agency cut its forecast for global oil demand. In this environment, light crude erased almost all Monday’s gains and dropped under the 50-day moving average. What does it mean for the commodity?
Let’s examine the charts below and find out (charts courtesy of http://stockcharts.com).
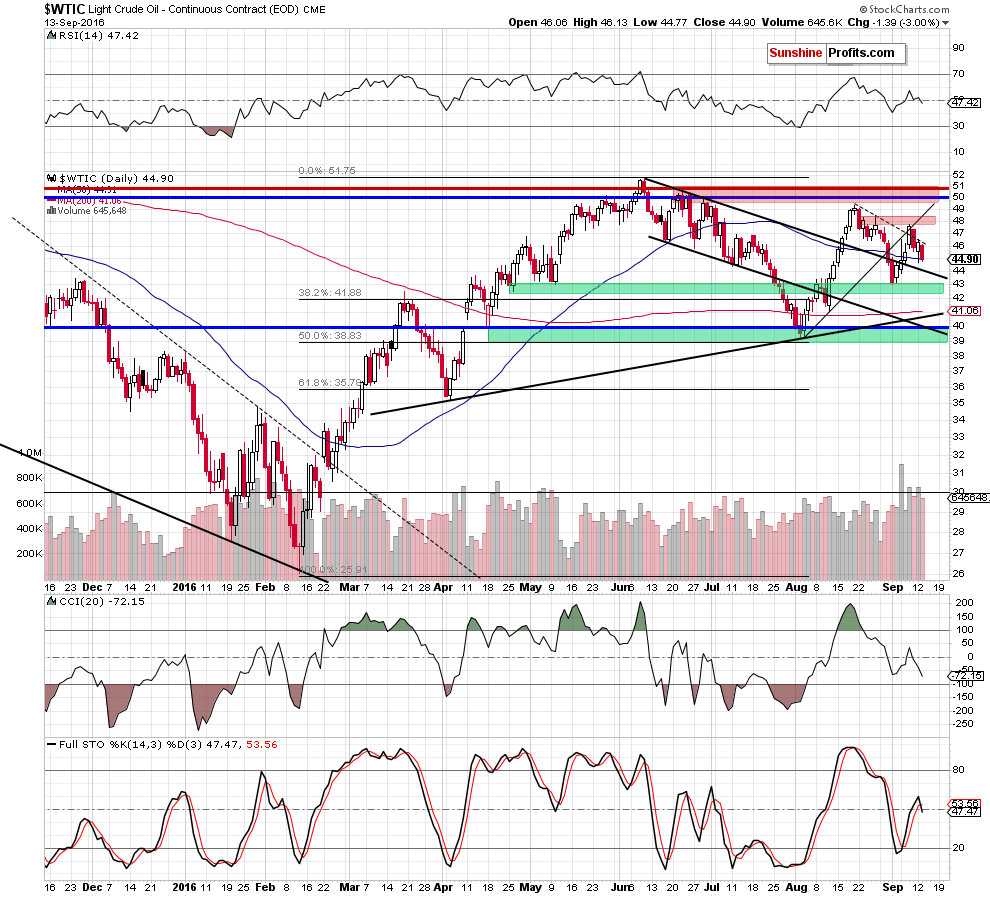
Looking at the daily chart, we see that although crude oil bounced off the 50-day moving average and climbed to an intraday high of $46.51on Monday, the black dashed resistance line based on the previous highs stopped oil bulls. This show of weakness triggered a decline on the following day, which erased almost all Monday’s gains.
With yesterday’s drop light crude slipped under the previously-broken 50-day moving average and closed the day below it, invalidating earlier breakout. Such price action doesn’t bode well for the commodity and suggests further deterioration.
On top of that, the Stochastic Oscillator generated a sell signal, giving oil bears another reason to act. Taking all the above into account, we think that crude oil will extend declines and (at least) test the upper border of the black declining trend channel (currently around $44.05) in the coming day. However, if this support is broken (which is quite likely when we consider the late Aug downward move), we’ll see a test of the Sep low of $43 and a re-test of the green support zone.
Having said the above, let’s examine the situation in the medium-term.
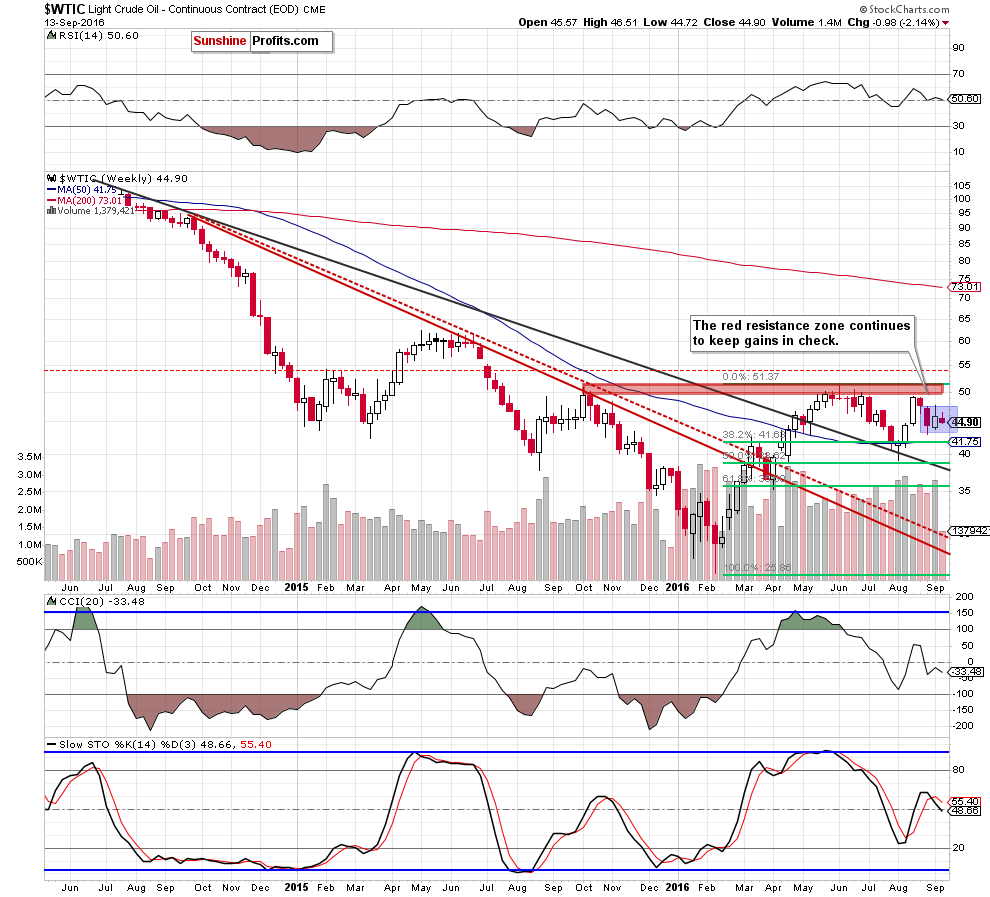
Looking at the weekly chart, we see that crude oil is consolidating between the late Aug high of $47.49 and late Aug low of $43, which suggests that as long as there won’t be a breakout or a breakdown another sizable move is not likely to be seen. Nevertheless, the Stochastic Oscillator generated a sell signal, supporting oil bears and another attempt to move lower.
Additionally, we should keep in mind that the commodity remains under the key resistance zone marked on the long-term chart below.
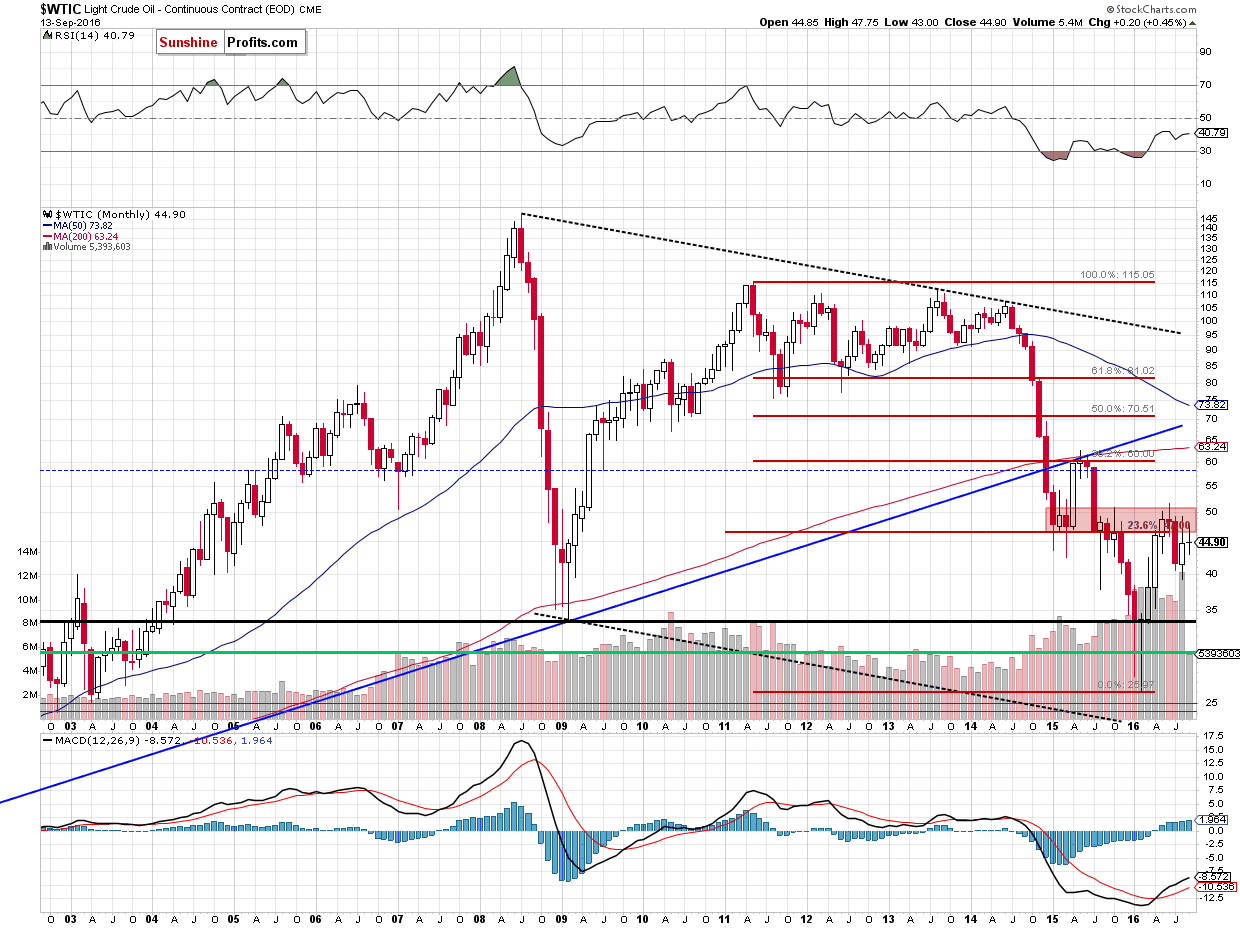
Therefore, in our opinion, another sizable move will be likely only if we see a breakout above this key resistance. Until this time short-lived moves in both directions (between the support and resistance zones) are very likely, which means that waiting at the sidelines for another profitable opportunity is justified from the risk/reward perspective.
Summing up, yesterday, crude oil declined, erasing almost all of Monday’s gains and invalidating earlier breakout above the 50-day moving average. Taking these negative events into account and combining them with sell signals generated by the daily and weekly Stochastic Oscillator, we think that the commodity will extend losses and test the upper border of the black declining trend channel or even the Sep low of $43 and the green support zone in the coming days.
Very short-term outlook: bearish
Short-term outlook: mixed
MT outlook: mixed
LT outlook: mixed
Trading position (short-term; our opinion): No positions are justified from the risk/reward perspective. We will keep you – our subscribers – informed should anything change.
Thank you.
Nadia Simmons
Forex & Oil Trading Strategist
Przemyslaw Radomski, CFA
Founder, Editor-in-chief, Gold & Silver Fund Manager
Gold & Silver Trading Alerts
Forex Trading Alerts
Oil Investment Updates
Oil Trading Alerts

