

Trading position (short-term; our opinion): No positions are justified from the risk/reward perspective.
On Friday, crude oil lost 0.31% as a stronger greenback and disappointing Baker Hughes’ report weighed on the price. As a result, light crude closed the day slightly below the previously-broken 38.2% Fibonacci retracement. Verification of the breakdown or just a pause before further improvement?
On Friday, the U.S. Department of Labor reported that the economy added 255,000 nonfarm payrolls in July, beating analysts’ expectations. As a result, the USD Index hit an intraday high of 96.50, making crude oil less attractive for buyers holding other currencies. Additionally, later in the day, the Baker Hughes’ report showed that U.S. oil rigs rose by 7 in the week ending on July 29. In these circumstances, light crude closed the day slightly below the previously-broken 38.2% Fibonacci retracement. Is this a verification of the breakdown or just a pause before further improvement? Let’s examine charts below and find out (charts courtesy of http://stockcharts.com).
On Thursday, we wrote the following:
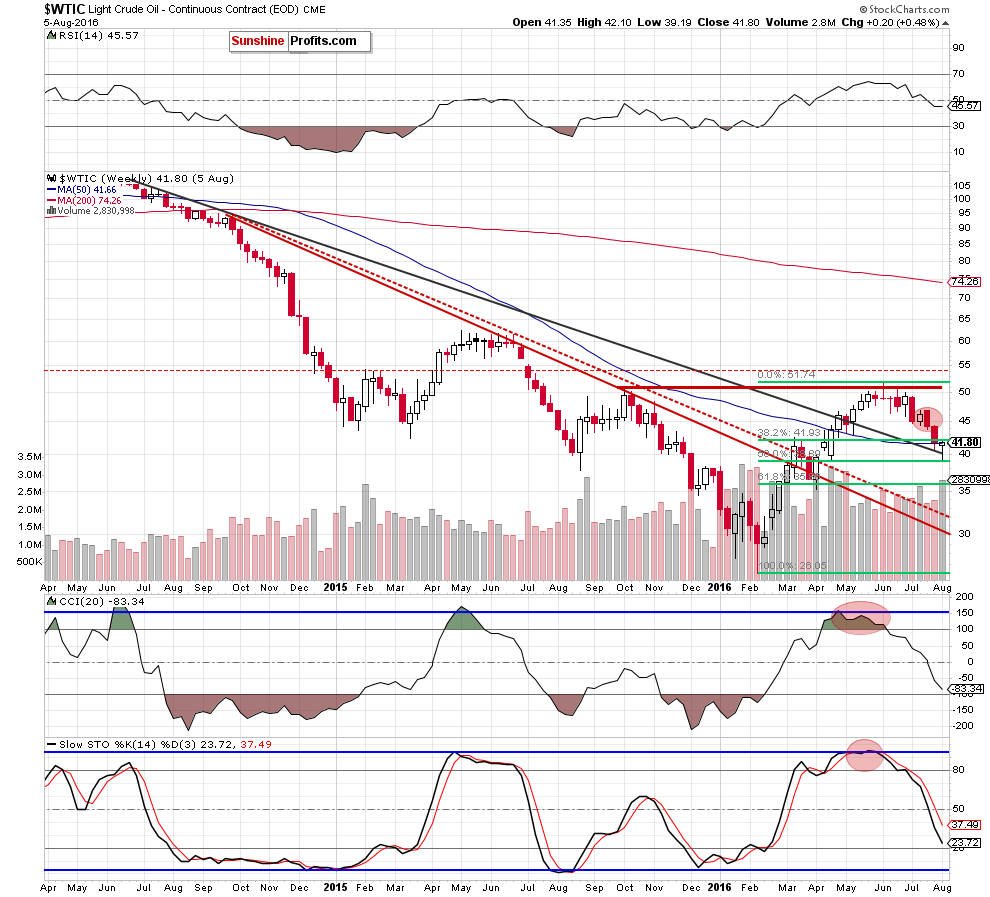
(…) The first thing that catches the eye on the weekly chart is invalidation of the breakdown under the long-term black declining line. This is a positive signal, which suggests further improvement. However, such price action will be more likely and reliable if crude oil closes the week above this important line.
From today’s point of view, we see that the situation developed in line with the above scenario and crude oil closed the previous week above the long-term black declining line. Taking this fact into account, we believe that what we wrote on Thursday remains up-to-date:
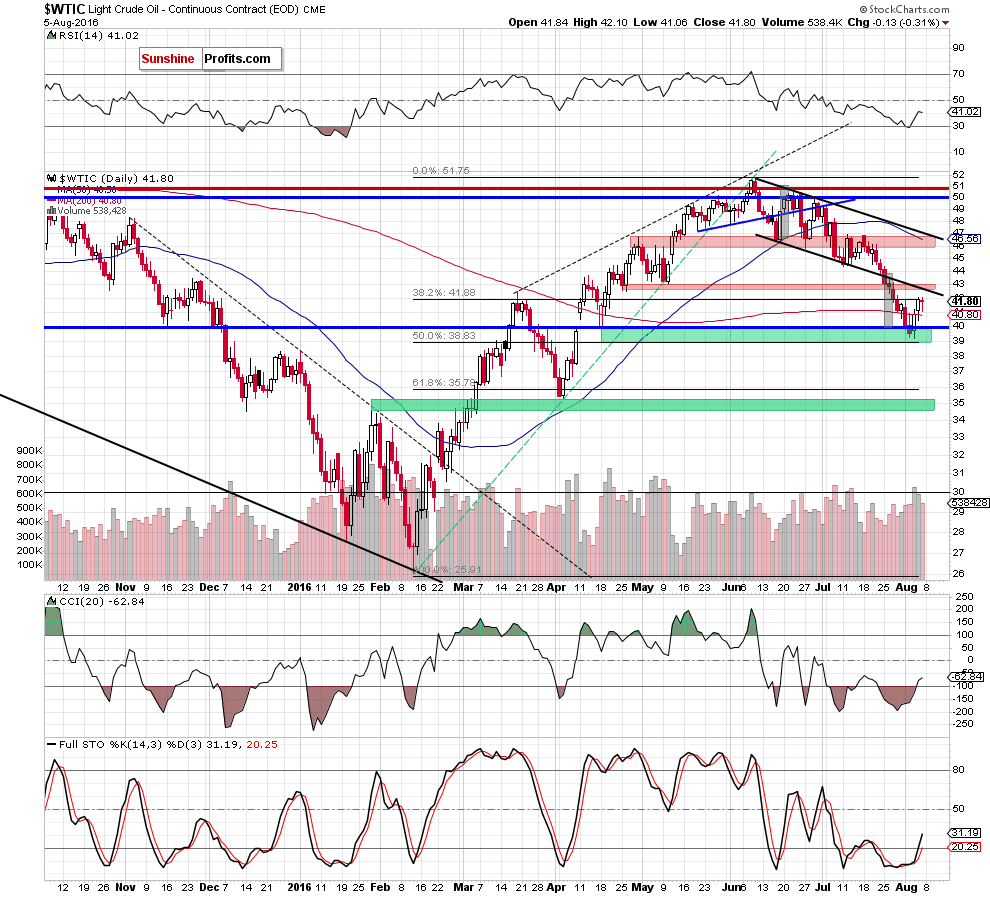
(…) From this perspective we see that (…) the green support zone triggered a quite sharp increase yesterday. With this upward move the commodity invalidated earlier breakdown under the barrier of $40, which is a bullish signal that suggests further improvement- especially when we factor in the size of volume that accompanied yesterday's increase (it was significant compared to what we saw during this week's declines). Additionally, the RSI and Stochastic Oscillator generated buy signals, supporting oil bulls and higher prices of light crude in the coming days. If this is the case and light crude extends increases from here the initial upside target would be the previously-broken lower border of the black declining trend channel (currently around $42.70).
Summing up, the green support zone encouraged oil bulls to act, which resulted in invalidation of the breakdown under the barrier of $40. Additionally, the commodity invalidated earlier breakdown under the 200-day moving average, which in combination with a weekly closure above the long-term black declining line (marked on the weekly chart) and buy signals generated by the daily indicators suggests further improvement and a test of the previously-broken lower border of the black declining trend channel (currently around $42.70).
Very short-term outlook: mixed with bullish bias
Short-term outlook: mixed
MT outlook: mixed
LT outlook: mixed
Trading position (short-term; our opinion): No positions are justified from the risk/reward perspective. We will keep you – our subscribers – informed should anything change.
Thank you.
Nadia Simmons
Forex & Oil Trading Strategist
Przemyslaw Radomski, CFA
Founder, Editor-in-chief
Gold & Silver Trading Alerts
Forex Trading Alerts
Oil Investment Updates
Oil Trading Alerts

