

Trading position (short-term; our opinion): Short positions (with a stop-loss order at $54.21 and initial downside target at $43.37) are justified from the risk/reward perspective.
On Friday, crude oil extended losses as a combination of news about rising Iraq's oil exports and report by BMI Research and Baker Hughes affected negatively investors’ sentiment. Thanks to these circumstances light crude lost 1.25% and slipped under the lower border of the consolidation. Will this event accelerate declines in the coming days?
On Friday, crude oil extended losses as news from the Middle East showed that Iraq's oil exports rose in the first 3 weeks of July to 3.28 million barrels per day from 3.18 million bpd in June. Additionally, the BMI Research’s report showed that demand for the fuel continues to wane in key Asian markets. On top of that, the Baker Hughes’ report showed that the number of active oil rigs in the U.S. increased by 14 to 371, posting the fourth consecutive week of gains and moving higher for the seventh time over the last eight weeks. Thanks to these circumstances light crude slipped under the lower border of the consolidation. Will this event accelerate declines in the coming days? Let’s examine charts below and find out (charts courtesy of http://stockcharts.com).
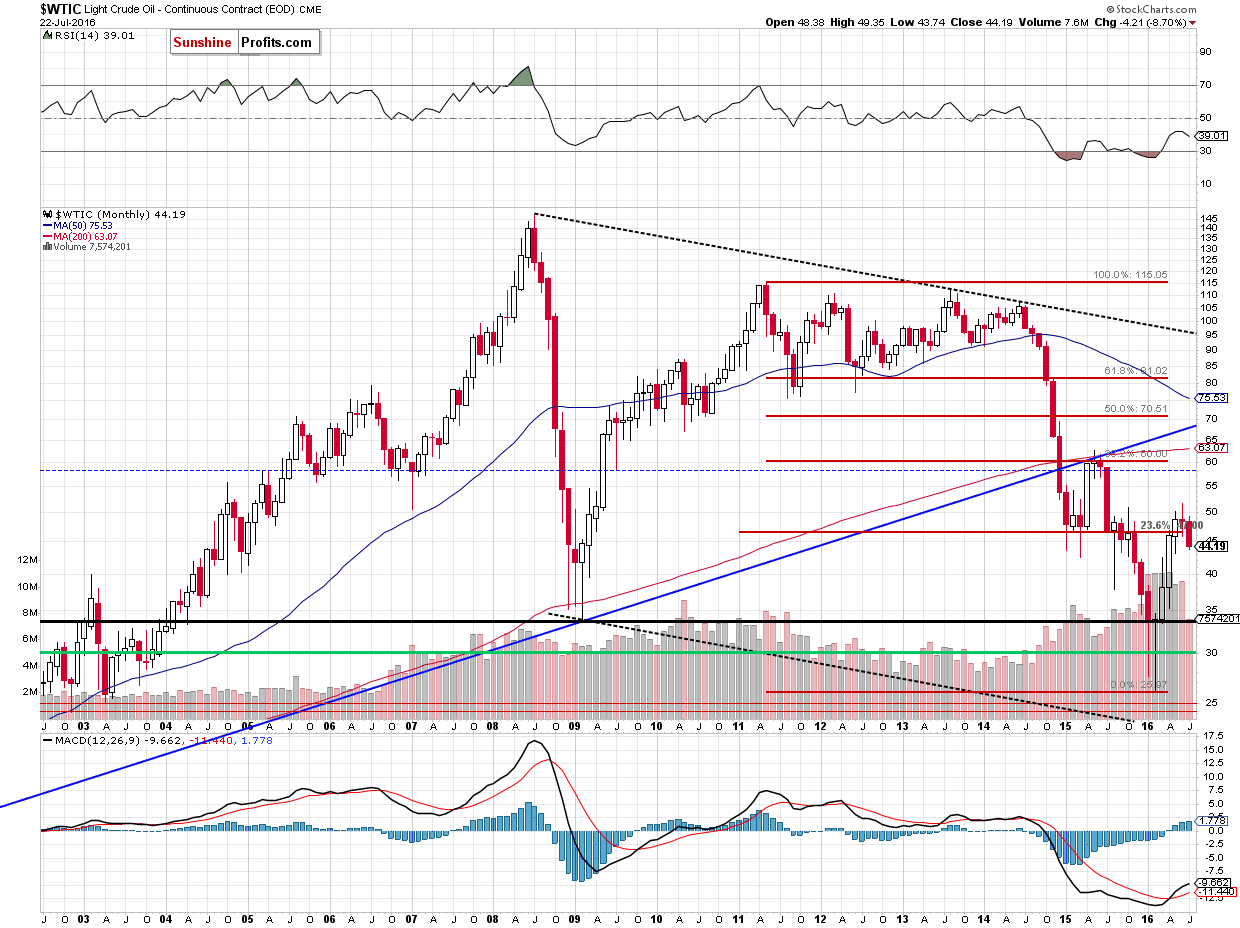
From the long-term perspective, we see that the commodity extended losses under the 23.6% Fibonacci retracement, which means that invalidation of earlier breakout above this resistance and its negative consequences are still in effect, supporting oil bears.
Having said the above, let’s examine the weekly chart and look for more factors that could push the commodity lower in the coming days.
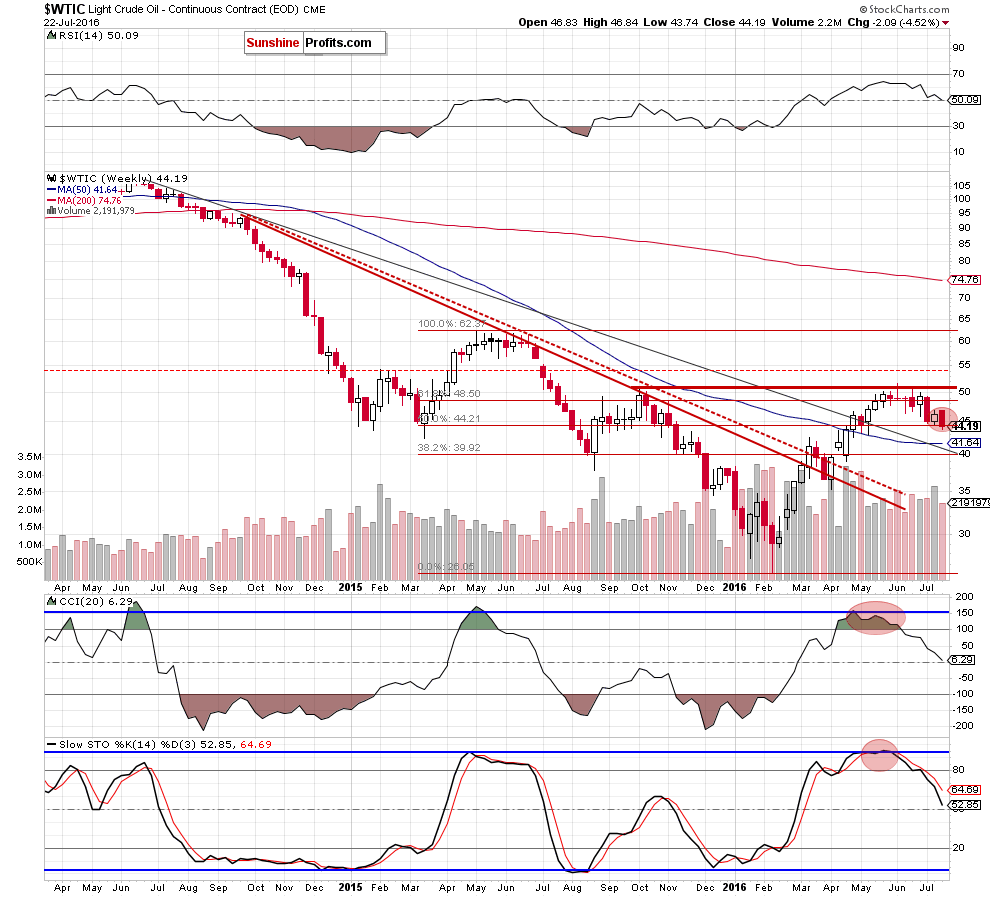
On the medium-term chart, we see that sell signals generated by the indicators are still in play, supporting lower prices of the commodity. On top of that, two recent candlesticks created a bearish engulfing pattern, which will serve as an additional resistance in the coming weeks.
Are there any other signals that could encourage oil bears to act? Let’s check the very short-term chart and find out.
On Thursday, we wrote the following:
(…) the commodity still remains in a consolidation between the Jul 12 high of $46.93 and low of $44.51, which means that even if light crude moves higher form here (even to the upper border of the formation), the overall situation will remain unchanged. Therefore, in our opinion, as long as there won’t be a breakout above the Jul 12 high or a breakdown under the lower border of the consolidation another sizable move is questionable and short-lived moves in both directions should not surprise us.
Nevertheless, (…) the Stochastic Oscillator generated a sell signal once again, suggesting that another reversal and lower prices of light crude are just around the corner.
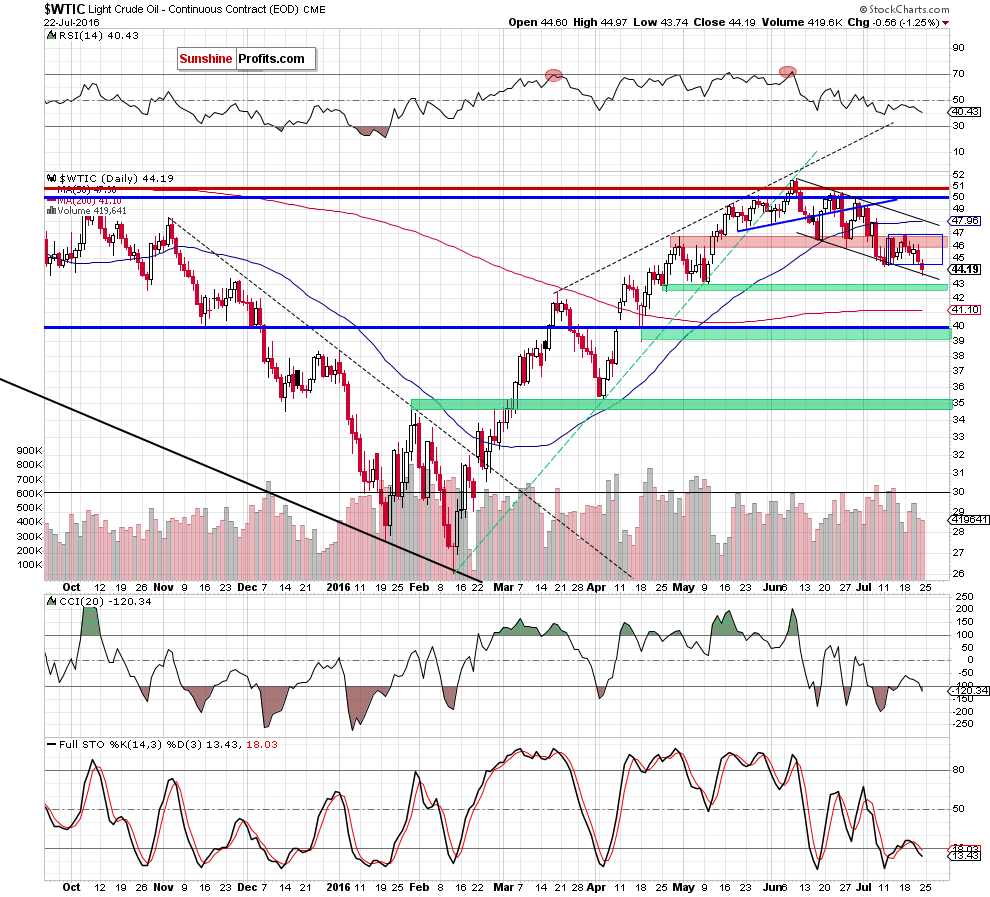
Looking at the daily chart from today’s point of view, we see that after many days in the consolidation, oil bears finally pushed the commodity under the lower line of the formation, which resulted in another drop to the lower border of the black declining trend channel. Although light crude may rebound from here (similarly to what we saw in previous weeks), we should keep in mind that crude oil closed Friday’s session below the consolidation, which in combination with sell signal generated by the Stochastic Oscillator suggests further deterioration – especially when we factor in the long- and medium-term picture of the commodity.
If this is the case, and light crude drops under the lower border of the trend channel, we’ll see (at least) a test of the nearest green support zone (around $42.50-$43.25) in the coming days.
Summing up, short positions (which are already profitable) continue to be justified from the risk/reward perspective as crude oil closed Friday’s session under the lower border of the blue consolidation, which increases the probability of further declines and suggests a test of the strength of the next green support zone (around $42.50-$43.25) in the coming days.
Very short-term outlook: bearish
Short-term outlook: bearish
MT outlook: bearish
LT outlook: mixed with bearish bias
Trading position (short-term; our opinion): Short positions (with a stop-loss order at $54.21 and initial downside target at $43.37) are justified from the risk/reward perspective. We will keep you informed should anything change, or should we see a confirmation/invalidation of the above.
As a reminder – “initial target price” means exactly that – an “initial” one, it’s not a price level at which we suggest closing positions. If this becomes the case (like it did in the previous trade) we will refer to these levels as levels of exit orders (exactly as we’ve done previously). Stop-loss levels, however, are naturally not “initial”, but something that, in our opinion, might be entered as an order.
Thank you.
Nadia Simmons
Forex & Oil Trading Strategist
Przemyslaw Radomski, CFA
Founder, Editor-in-chief
Gold & Silver Trading Alerts
Forex Trading Alerts
Oil Investment Updates
Oil Trading Alerts

