

Trading position (short-term; our opinion): Short positions (with a stop-loss order at $48.56 and initial downside target at $35.24) are justified from the risk/reward perspective.
Although crude oil moved higher after the market’s open, the key resistance zone stopped oil bulls once again, triggering another invalidation of earlier small breakout. What impact did this event have on the black gold?
Let’s examine charts and find out (charts courtesy of http://stockcharts.com).
Quoting our Friday’s alert:
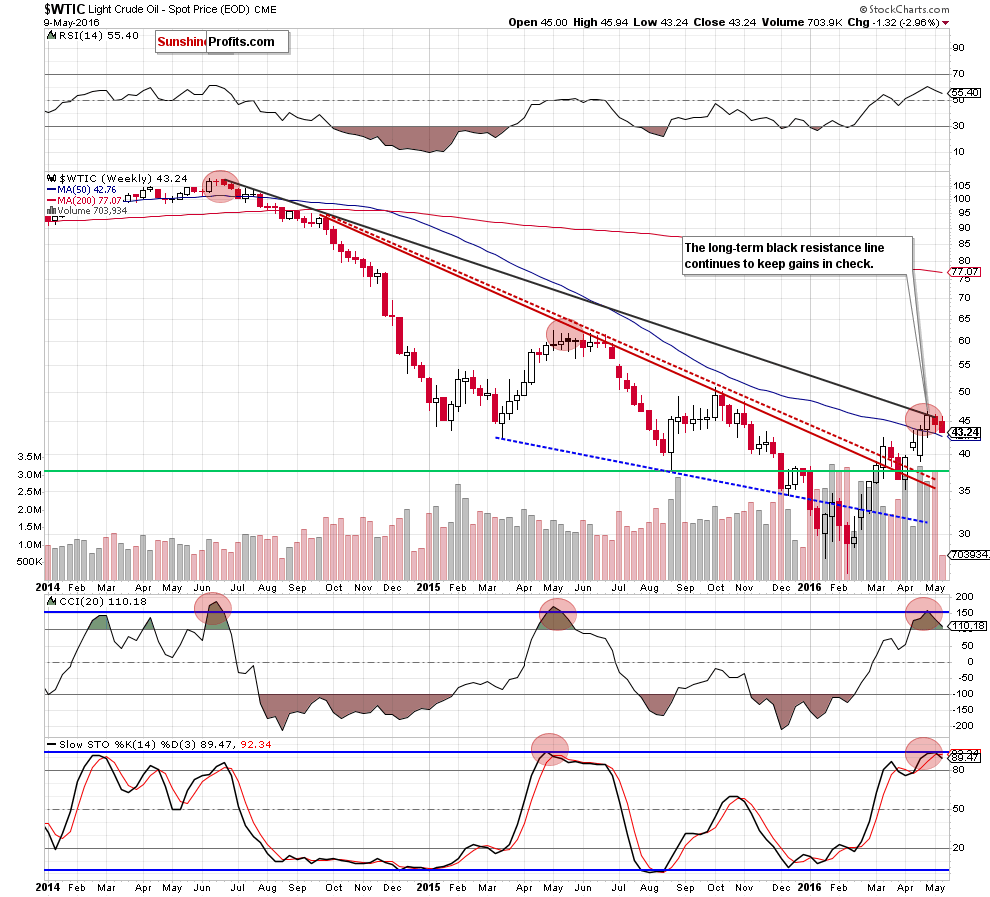
(…) although crude oil moved little higher yesterday, this upswing didn’t change anything as black gold is still trading under the long-term black resistance line, which means that invalidation of earlier small breakout and its negative impact on the price is still in play. Therefore, further deterioration in the coming week should not surprise us – especially if light crude closes this week under the black line.
As you see on the weekly chart, the situation developed in line with the above scenario and crude oil closed the previous week under the black line, which encouraged oil bears to act. Additionally, the Stochastic Oscillator generated a sell signal, supporting further deterioration in the coming days – especially if we see decline under the 50-week moving average in near future.
Having said the above, let’s check what we can infer from the daily chart.
On Friday, we wrote the following:
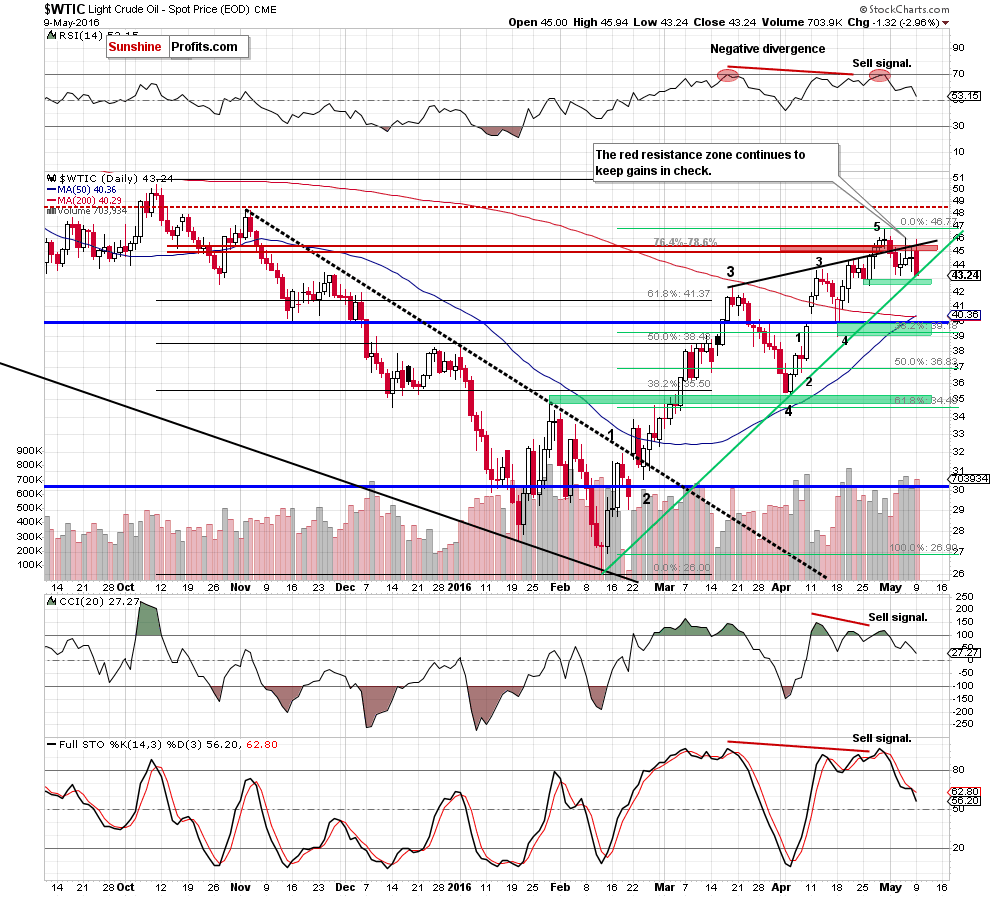
(…) crude oil slipped under the black resistance line and the red resistance zone, invalidating earlier breakout once again. In our opinion, this is an additional negative signal, which suggests further deterioration in the coming week – especially when we factor in sell signals generated by the indicators, which continue to support oil bears and lower prices. If this is the case, and light crude moves lower from current levels – we’ll see a drop to the first support area and the green support line (around $42.68) in near future.
From today’s point of view, we see that currency bears pushed the commodity lower as we had expected and light crude declined sharply, reaching the medium-term green line based on the Feb and Apr lows. With this move, crude oil also approached the last week’s lows and the first green support zone, which together could trigger a rebound later in the day. Nevertheless, even if we see such price action, sell signals remain in play, suggesting that lower prices of the commodity are just around the corner. When can we expect acceleration of declines? In our opinion, a breakthrough will come when light crude drop below the green line -especially when we see a daily closure under this important line.
Are there any other factors that could support the pro-bearish scenario? Let’s take a closer look at the oil-to-oil stocks ratio.
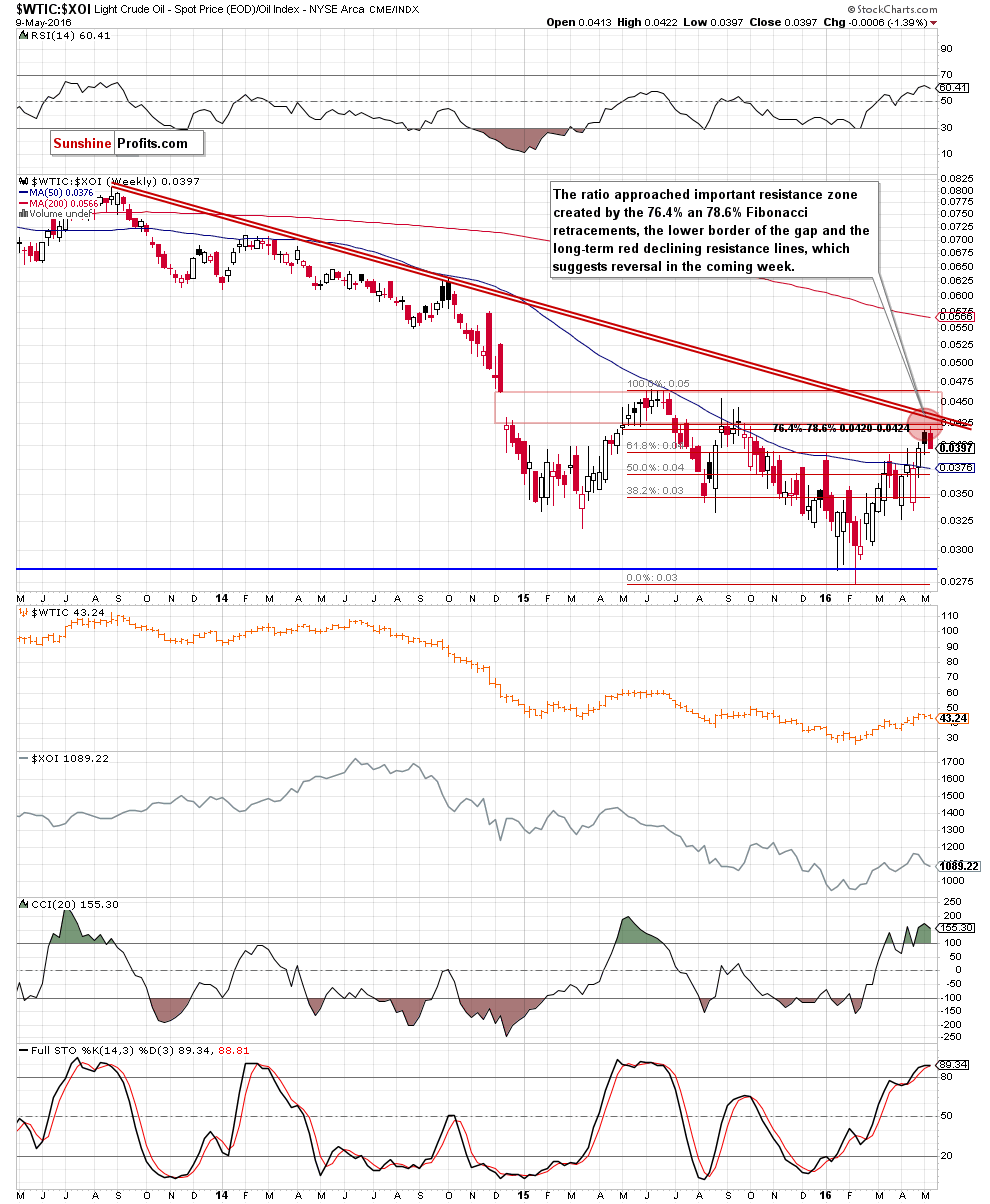
Looking at the above chart, we see that the ratio approached important resistance zone created by the 76.4% and 78.6% Fibonacci retracement levels (based on the entire Jun 2015-Feb 2016 declines). In this area is also the lower border of the gap (seen in Dec 2014) and the long-term red declining resistance lines, which could stop further improvement in the coming week. Additionally, the CCI and Stochastic Oscillator increased to levels not seen since Jun 2015, which suggests that reversal in the coming week is very likely. If this is the case and the ratio declines from current levels, we’ll also see lower values of crude oil and oil stocks later in May – similarly to what we noticed in the past (if you want to know more about the current situation in oil stocks we encouraged to read our yesterday’s article on this topic).
Summing up, after three unsuccessful attempts to climb above the red resistance zone and the black resistance line (marked on the daily chart) oil bulls surrendered, which resulted in a sharp decline that took the commodity to the first support area that could trigger a rebound later in the day. Nevertheless, sell signals remain in play, supporting further deterioration in the coming days.
Very short-term outlook: bearish
Short-term outlook: bearish
MT outlook: bearish
LT outlook: mixed with bearish bias
Trading position (short-term; our opinion): Short positions (with a stop-loss order at $48.56 and initial downside target at $35.24) are justified from the risk/reward perspective. We will keep you informed should anything change, or should we see a confirmation/invalidation of the above.
As a reminder – “initial target price” means exactly that – an “initial” one, it’s not a price level at which we suggest closing positions. If this becomes the case (like it did in the previous trade) we will refer to these levels as levels of exit orders (exactly as we’ve done previously). Stop-loss levels, however, are naturally not “initial”, but something that, in our opinion, might be entered as an order.
Since it is impossible to synchronize target prices and stop-loss levels for all the ETFs and ETNs with the main market that we provide this level for (crude oil), the stop-loss level and target price for popular ETN and ETF (among other: USO, DWTI, UWTI) are provided as supplementary, and not as “final”. This means that if a stop-loss or a target level is reached for any of the “additional instruments” (DWTI for instance), but not for the “main instrument” (crude oil in this case), we will view positions in both crude oil and DWTI as still open and the stop-loss for DWTI would have to be moved lower. On the other hand, if crude oil moves to a stop-loss level but DWTI doesn’t, then we will view both positions (in crude oil and DWTI) as closed. In other words, since it’s not possible to be 100% certain that each related instrument moves to a given level when the underlying instrument does, we can’t provide levels that would be binding. The levels that we do provide are our best estimate of the levels that will correspond to the levels in the underlying assets, but it will be the underlying assets that one will need to focus on regarding the sings pointing to closing a given position or keeping it open. We might adjust the levels in the “additional instruments” without adjusting the levels in the “main instruments”, which will simply mean that we have improved our estimation of these levels, not that we changed our outlook on the markets.
Thank you.
Nadia Simmons
Forex & Oil Trading Strategist
Przemyslaw Radomski, CFA
Founder, Editor-in-chief
Gold & Silver Trading Alerts
Forex Trading Alerts
Oil Investment Updates
Oil Trading Alerts

