

Trading position (short-term; our opinion): Short positions (with a stop-loss order at $48.56 and initial downside target at $35.24) are justified from the risk/reward perspective.
On Monday, crude oil lost 2.39% as worries over the latest production increases from OPEC pushed the price lower. As a result, the commodity dropped under the previously-broken resistance levels, invalidating earlier breakouts. What does it mean for light crude?
Yesterday, crude oil moved lower as investors continued to digest Friday’s report, which showed that OPEC increased production by 170,000 barrels per day in the previous month. Thanks to these circumstances, light crude moved lower and closed the day under the previously-broken resistance levels, invalidating earlier breakouts. What does it mean for light crude? Let’s examine charts and find out (charts courtesy of http://stockcharts.com).
Quoting our Friday’s alert:
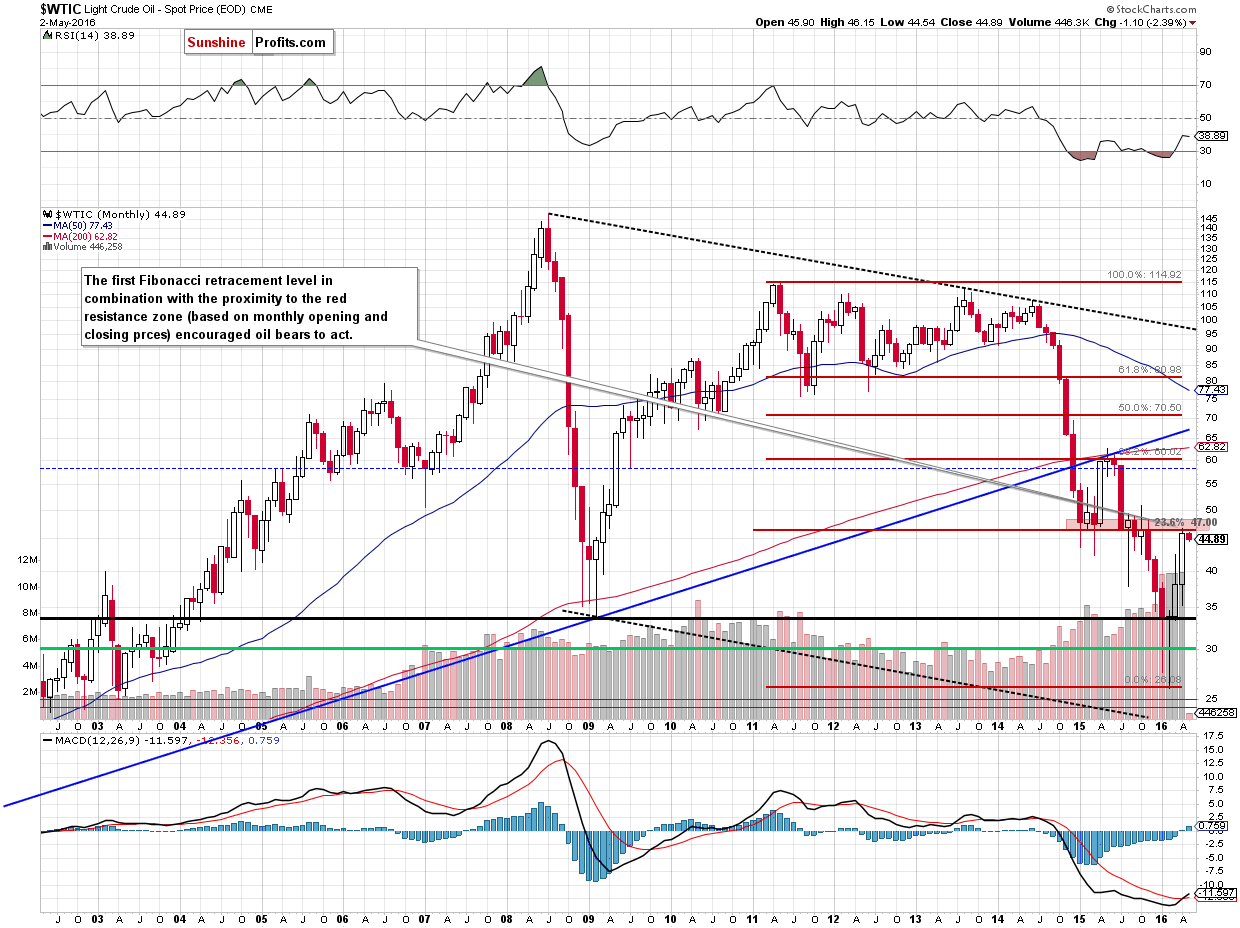
(…) the recent upward move approached crude oil to the first Fibonacci retracement level based on the entire Apr 2011-Feb 2016 downward move (around $47). Additionally, slightly above this resistance level is also red resistance zone (created by the Jan, Feb, March, Apr, Jul, Aug, Oct and Nov 2015 monthly opening and closing prices), which could stop oil bulls in the coming week.
From today’s point of view, we see that the above-mentioned resistance zone encouraged oil bears to act yesterday. What impact did this move have on the weekly chart? Let’s check.
On Friday, we wrote the following:
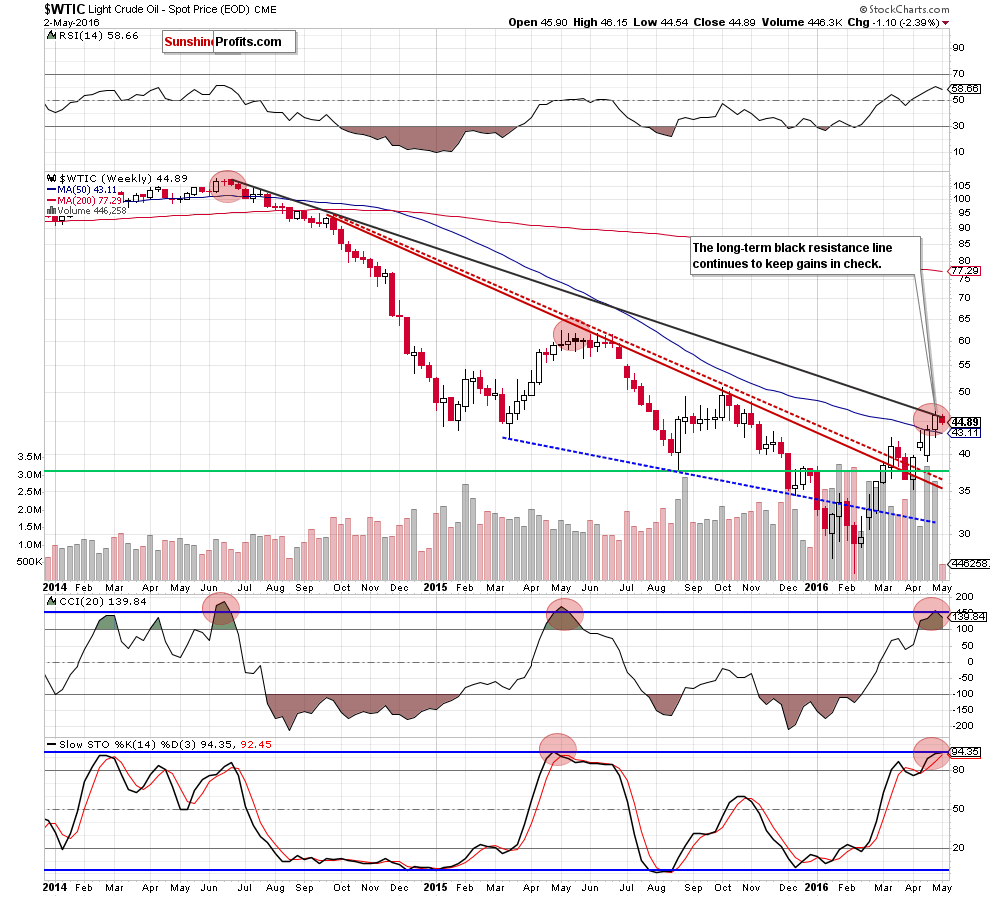
(…) crude oil extended gains and almost touched the long-term black declining resistance line, which increases the probability of reversal in the coming week– especially when we factor in very high readings of the CCI and Stochastic Oscillator. As you see, we noticed such high values of these indicators before major reversals in Jun 2014 and May 2015, which suggests that another one is just around the corner.
On the weekly chart, we see that the situation developed in line with the above scenario and crude oil moved lower earlier this week. Thanks to yesterday’s drop light crude declined under the long-term black resistance line, invalidating earlier small breakout, which is a bearish signal that suggests further deterioration in the coming week.
How did this move affect the daily chart?
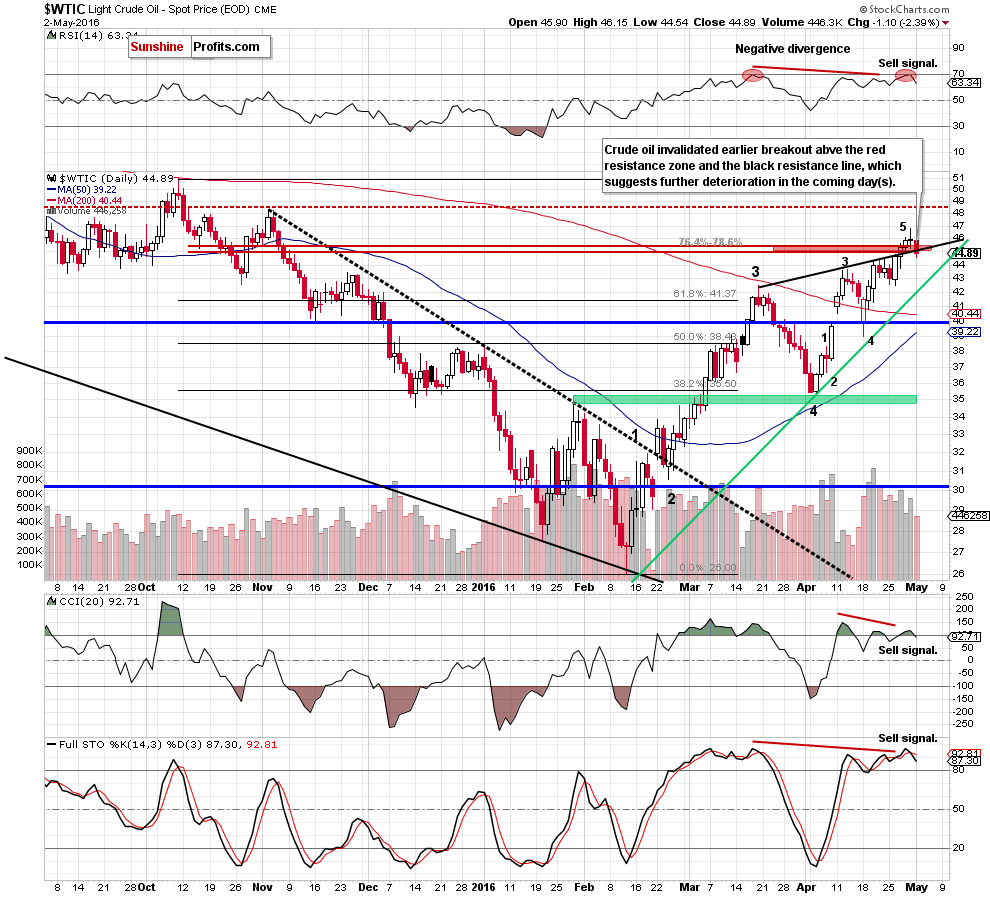
From this perspective we see that crude oil declined on Monday, which resulted in a drop under the previously-broken red resistance zone and the black resistance line. In this way, the commodity invalidated earlier breakouts, which is a bearish signal. Additionally, all indicators generated sell signals, which in combination with the long- and medium-term picture suggest further deterioration in the coming days.
If this is the case and light crude extends losses, the initial downside target would be around $42.50-$42.60, where the late-Apr lows and the medium-term green support line (based on the Feb and Apr lows) are.
Summing up, the proximity to the 23.6% Fibonacci retracement and the long-term declining resistance line (marked on the weekly chart) encouraged oil bears to act, which resulted in invalidation of the breakout above the previously-broken red resistance zone and the black resistance line (both marked on the daily chart). This is a bearish sign, which in combination with sell signals generated by all daily indicators suggests further deterioration in the coming days.
Very short-term outlook: bearish
Short-term outlook: bearish
MT outlook: bearish
LT outlook: mixed with bearish bias
Trading position (short-term; our opinion): Short positions (with a stop-loss order at $48.56 and initial downside target at $35.24) are justified from the risk/reward perspective. We will keep you informed should anything change, or should we see a confirmation/invalidation of the above.
As a reminder – “initial target price” means exactly that – an “initial” one, it’s not a price level at which we suggest closing positions. If this becomes the case (like it did in the previous trade) we will refer to these levels as levels of exit orders (exactly as we’ve done previously). Stop-loss levels, however, are naturally not “initial”, but something that, in our opinion, might be entered as an order.
Since it is impossible to synchronize target prices and stop-loss levels for all the ETFs and ETNs with the main market that we provide this level for (crude oil), the stop-loss level and target price for popular ETN and ETF (among other: USO, DWTI, UWTI) are provided as supplementary, and not as “final”. This means that if a stop-loss or a target level is reached for any of the “additional instruments” (DWTI for instance), but not for the “main instrument” (crude oil in this case), we will view positions in both crude oil and DWTI as still open and the stop-loss for DWTI would have to be moved lower. On the other hand, if crude oil moves to a stop-loss level but DWTI doesn’t, then we will view both positions (in crude oil and DWTI) as closed. In other words, since it’s not possible to be 100% certain that each related instrument moves to a given level when the underlying instrument does, we can’t provide levels that would be binding. The levels that we do provide are our best estimate of the levels that will correspond to the levels in the underlying assets, but it will be the underlying assets that one will need to focus on regarding the sings pointing to closing a given position or keeping it open. We might adjust the levels in the “additional instruments” without adjusting the levels in the “main instruments”, which will simply mean that we have improved our estimation of these levels, not that we changed our outlook on the markets.
Thank you.
Nadia Simmons
Forex & Oil Trading Strategist
Przemyslaw Radomski, CFA
Founder, Editor-in-chief
Gold & Silver Trading Alerts
Forex Trading Alerts
Oil Investment Updates
Oil Trading Alerts

