

Trading position (short-term; our opinion): Short positions (with a stop-loss order at $48.56 and initial downside target at $35.24) are justified from the risk/reward perspective.
Although crude oil moved sharply lower after the EIA report, the commodity reversed and rebounded in the following hours, supported by weakening U.S. dollar. As a result, light crude hit a fresh 2016 high and tested important resistance zone. Will it encourage oil bears to act in the coming days?
Yesterday, the U.S. Energy Information Administration reported that crude inventories increased by 2.0 million barrels for the week ending on April 22. Additionally, gasoline inventories rose by 1.6 million barrels, while distillate decreased by 1.7 million barrels. The report also showed that crude stockpiles at the Cushing Oil Hub in Oklahoma increased by 1.75 million barrels last week. Thanks to these bearish numbers, light crude moved sharply lower and hit an intraday low of $43.77. Despite this drop, investors digested that U.S. production declined by 15,000 barrels per day, hitting a fresh 18-month low. As a result, light crude reversed and rebounded in the following hours. The commodity received also an additional support after the FOMC left the target range on its benchmark Federal Funds Rate unchanged, which pushed the U.S. dollar lower, making crude oil more attractive for buyers holding other currencies. In this way, light crude hit a fresh 2016 high and tested important resistance zone. Will it encourage oil bears to act in the coming days? Let’s examine charts (charts courtesy of http://stockcharts.com).
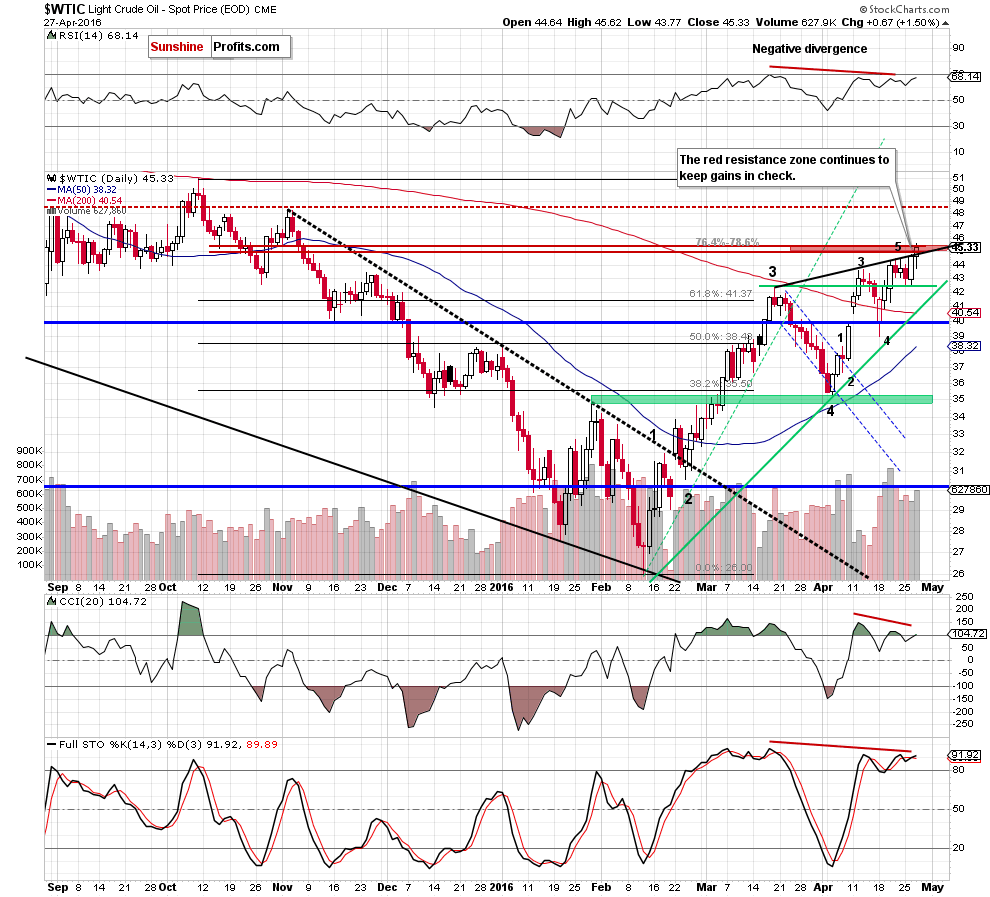
Looking at the daily chart, we see that although crude oil moved lower after the market’s open, oil bulls didn’t give up and pushed the commodity above the black resistance line once again. As a result, light crude climbed above the Tuesday’s peak and tested the strength of the red resistance zone (created by the 76.4% and 78.6% Fibonacci retracement levels based on the Oct-Feb downward move), hitting a fresh high.
What’s next? As you see on the chart, crude oil closed yesterday’s session under the upper border of the red zone, which suggests that as long as there won’t be confirmed breakout above this resistance further rally is not likely to be seen. Additionally, yesterday’s increase didn’t materialize on significant volume, which in combination with negative divergences between indicators and the price suggests that reversal in the coming day(s) is very likely.
Are there any other technical factors that could encourage oil bears to act? Let’s examine the medium-term chart and find out.
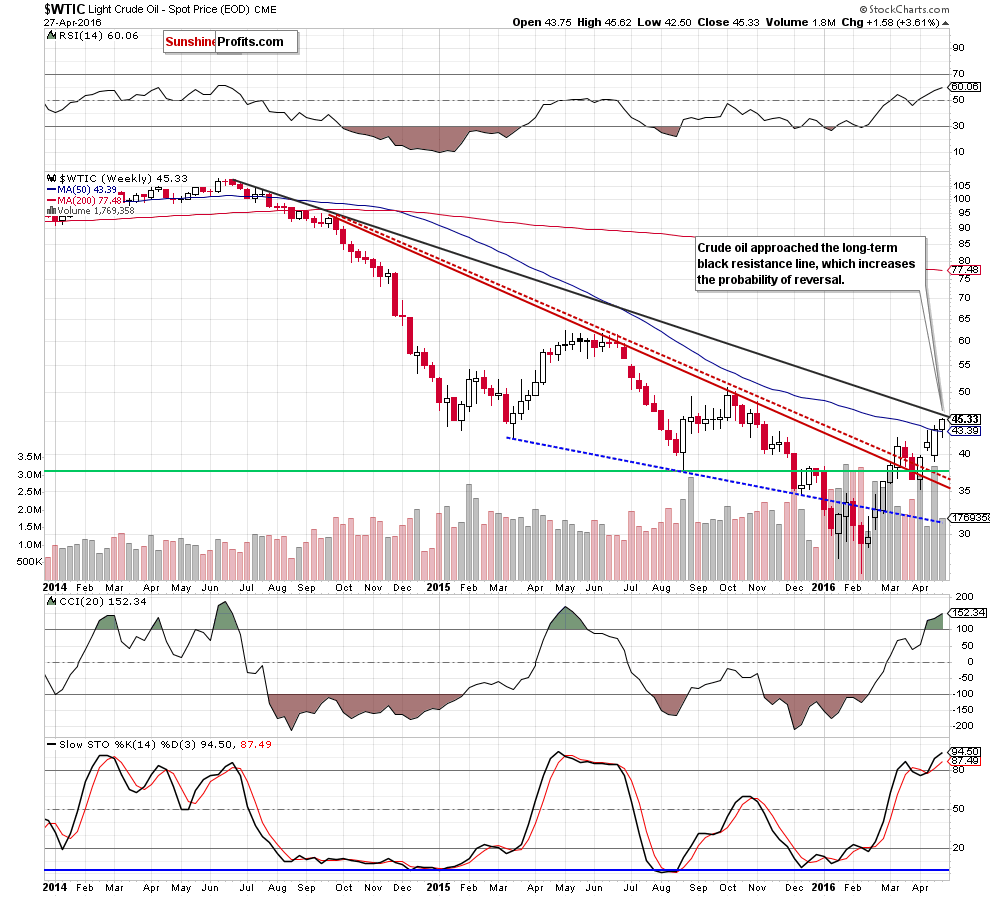
From this perspective, we see that crude oil extended gains and approached the long-term black declining resistance line, which increases the probability of reversal.
Summing up, although crude oil hit a fresh high, the red resistance zone marked on the daily chart continues to keep gains in check. Additionally, the commodity approached the long-term declining line, which increases the probability of reversal in the coming day(s).
Very short-term outlook: bearish
Short-term outlook: bearish
MT outlook: bearish
LT outlook: mixed with bearish bias
Trading position (short-term; our opinion): Short positions (with a stop-loss order at $48.56 and initial downside target at $35.24) are justified from the risk/reward perspective. We will keep you informed should anything change, or should we see a confirmation/invalidation of the above.
As a reminder – “initial target price” means exactly that – an “initial” one, it’s not a price level at which we suggest closing positions. If this becomes the case (like it did in the previous trade) we will refer to these levels as levels of exit orders (exactly as we’ve done previously). Stop-loss levels, however, are naturally not “initial”, but something that, in our opinion, might be entered as an order.
Since it is impossible to synchronize target prices and stop-loss levels for all the ETFs and ETNs with the main market that we provide this level for (crude oil), the stop-loss level and target price for popular ETN and ETF (among other: USO, DWTI, UWTI) are provided as supplementary, and not as “final”. This means that if a stop-loss or a target level is reached for any of the “additional instruments” (DWTI for instance), but not for the “main instrument” (crude oil in this case), we will view positions in both crude oil and DWTI as still open and the stop-loss for DWTI would have to be moved lower. On the other hand, if crude oil moves to a stop-loss level but DWTI doesn’t, then we will view both positions (in crude oil and DWTI) as closed. In other words, since it’s not possible to be 100% certain that each related instrument moves to a given level when the underlying instrument does, we can’t provide levels that would be binding. The levels that we do provide are our best estimate of the levels that will correspond to the levels in the underlying assets, but it will be the underlying assets that one will need to focus on regarding the sings pointing to closing a given position or keeping it open. We might adjust the levels in the “additional instruments” without adjusting the levels in the “main instruments”, which will simply mean that we have improved our estimation of these levels, not that we changed our outlook on the markets.
Thank you.
Nadia Simmons
Forex & Oil Trading Strategist
Przemyslaw Radomski, CFA
Founder, Editor-in-chief
Gold & Silver Trading Alerts
Forex Trading Alerts
Oil Investment Updates
Oil Trading Alerts

