

Trading position (short-term; our opinion): No positions are justified from the risk/reward perspective.
On Thursday, crude oil moved slightly lower as uncertainty around weekend’s meeting between major oil producers in Doha weighed on investors’ sentiment. What’s next for the commodity? Before we know the outcome of this highly anticipated event, let’s take a closer look at the technical picture of crude oil. What can we infer from it about future moves?
Let’s examine charts and find out (charts courtesy of http://stockcharts.com).
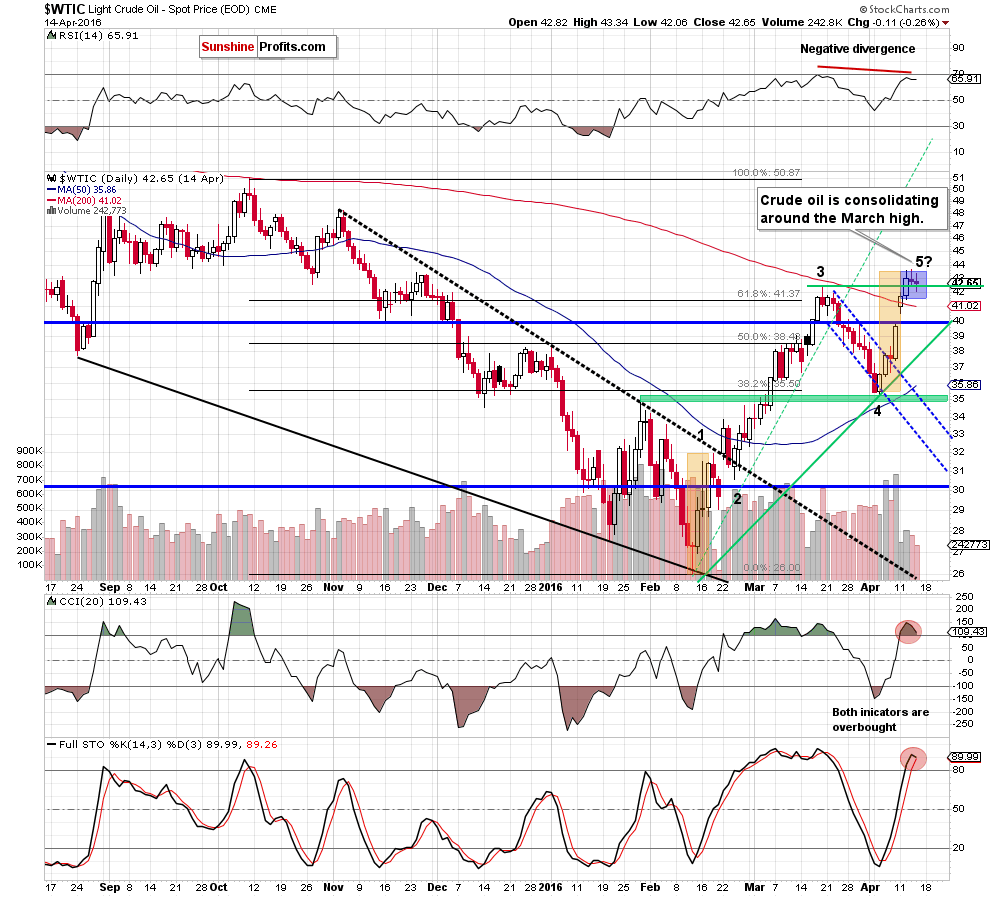
Looking at the daily chart, we see that although crude oil moved little lower yesterday, the overall situation hasn’t changed much as the commodity remains in the blue consolidation around the March high. Nevertheless, when we take a look at the current position of the indicators, we clearly see that there is negative divergence between the RSI and light crude, which is a negative signal. Additionally, the CCI and Stochastic Oscillator are overbought - similarly to what we saw in mid-March. Back then, similar readings preceded correction of earlier rally, which suggests that we may see another attempt to move lower on the coming week. However, in our opinion, such price action will be more reliable if we see daily closure under the March high and an invalidation of the breakout above the 200-day moving average.
Before we zoom out our picture and examine the weekly chart, we would like to draw your attention to the recent rally from a slightly different perspective - the perspective of Elliott Wave Theory. We realize that this theory has as many supporters as opponents, but the current layout of the waves seems too interesting to not to comment it.
On the daily chart, we marked all five potential waves. The upward move from Feb 11 to Feb 18 (marked with orange) seems to be the first wave. After interesting correction, crude oil moved sharply higher, which fits to the specifics of the third wave. In mid-March, the commodity corrected almost 50% of earlier rally, which looks like the fourth wave, which preceded the last upward move between Apr 5 and Apr 13. As you see, the first and the potential fifth wave are quite similar – not only in size but also in terms of time, which increases the probability of reversal in the coming week.
Are there any other technical factors that could support this scenario? As we mentioned earlier, let’s examine the medium-term chart and find out.
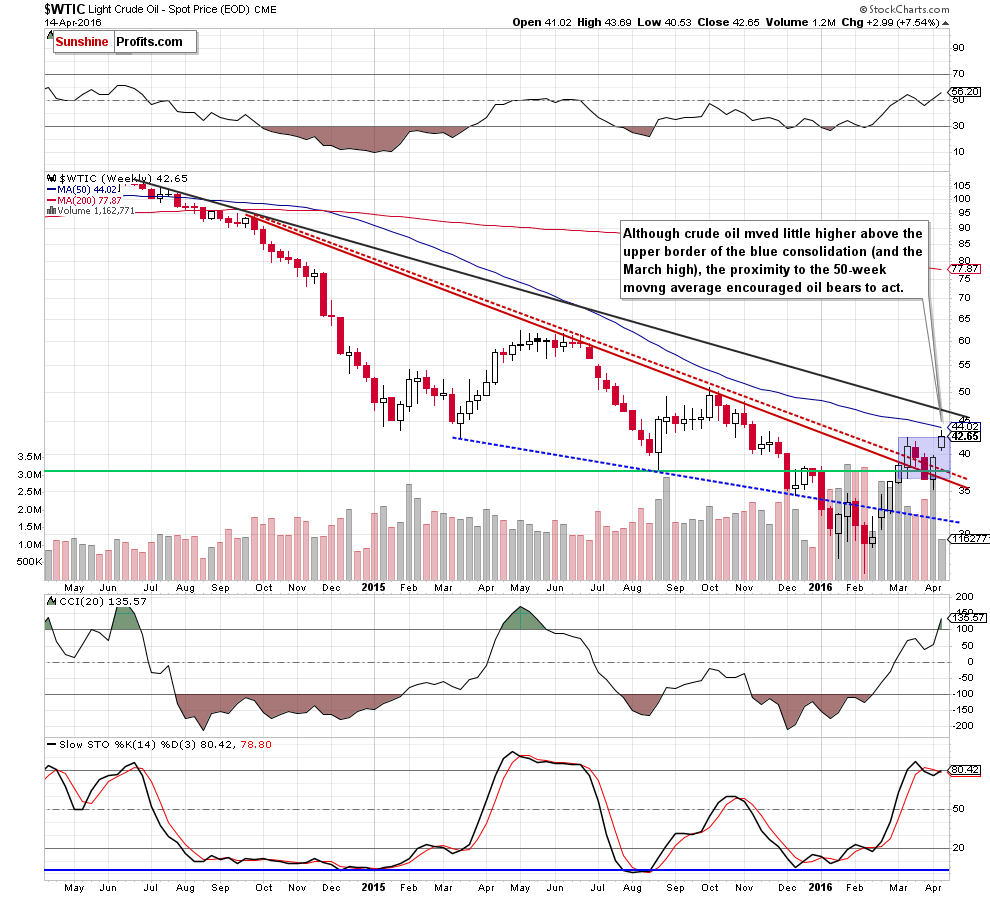
From this perspective, we see that although light crude moved slightly above the upper border of the blue consolidation (and the March high), the proximity to the 50-week moving average encouraged oil bears to act, which resulted in recent small pullbacks. Additionally, the CCI and Stochastic Oscillator are overbought, which increases the probability of reversal.
Nevertheless, to have a more complete picture of the commodity, we also examined the oil-to-silver ratio and gold-to-oil ratios.
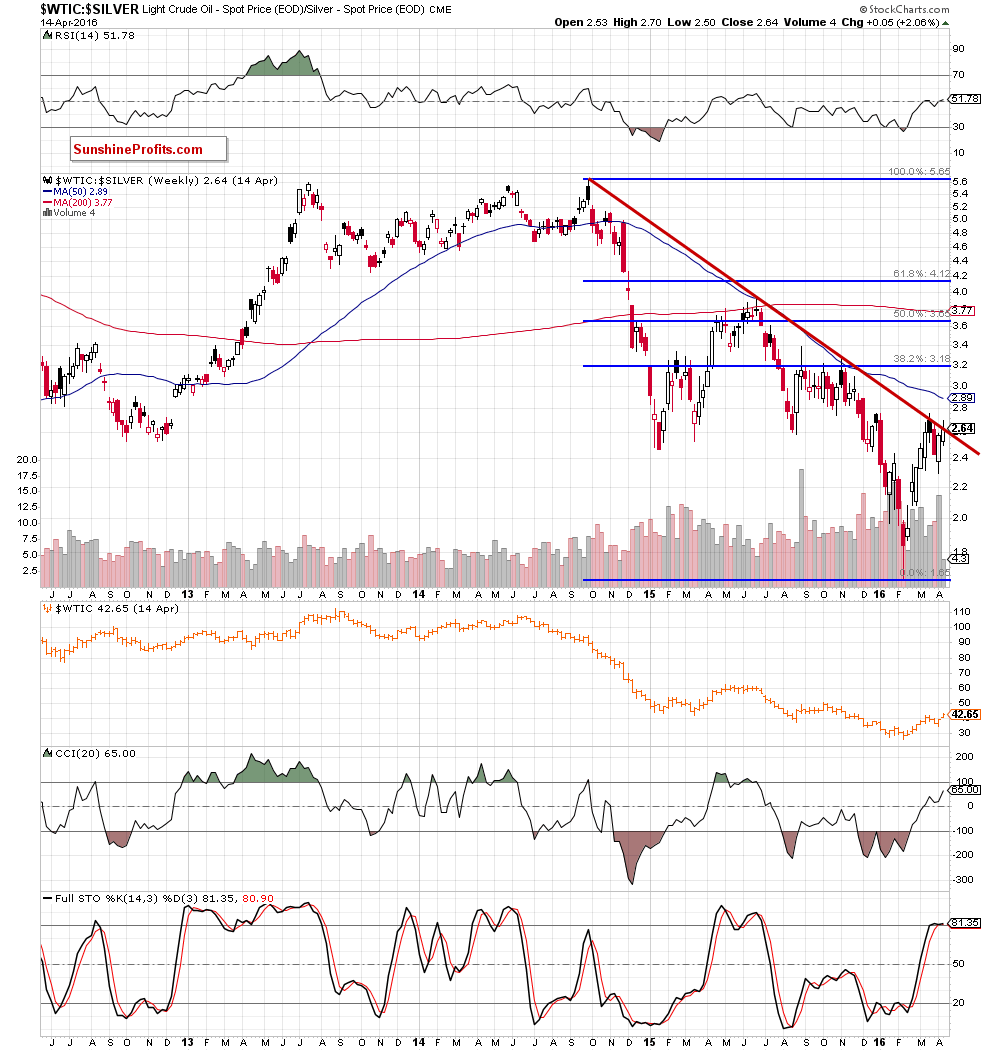
On the above chart, we clearly see that the ratio reached the long-term red declining resistance line, which successfully stopped further improvement several times in the past. In all cases, oil bulls were not strong enough to push the ratio higher, which resulted in reversal and declines – not only in the ratio, but also in crude oil. Therefore, looking at the above chart, we think that anther reversal is just around the corner. Additionally, the Stochastic Oscillator is very close to generating a sell signal, which is another negative signal.
Having said the above, let’s take a closer look at the gold-to-oil ratio.
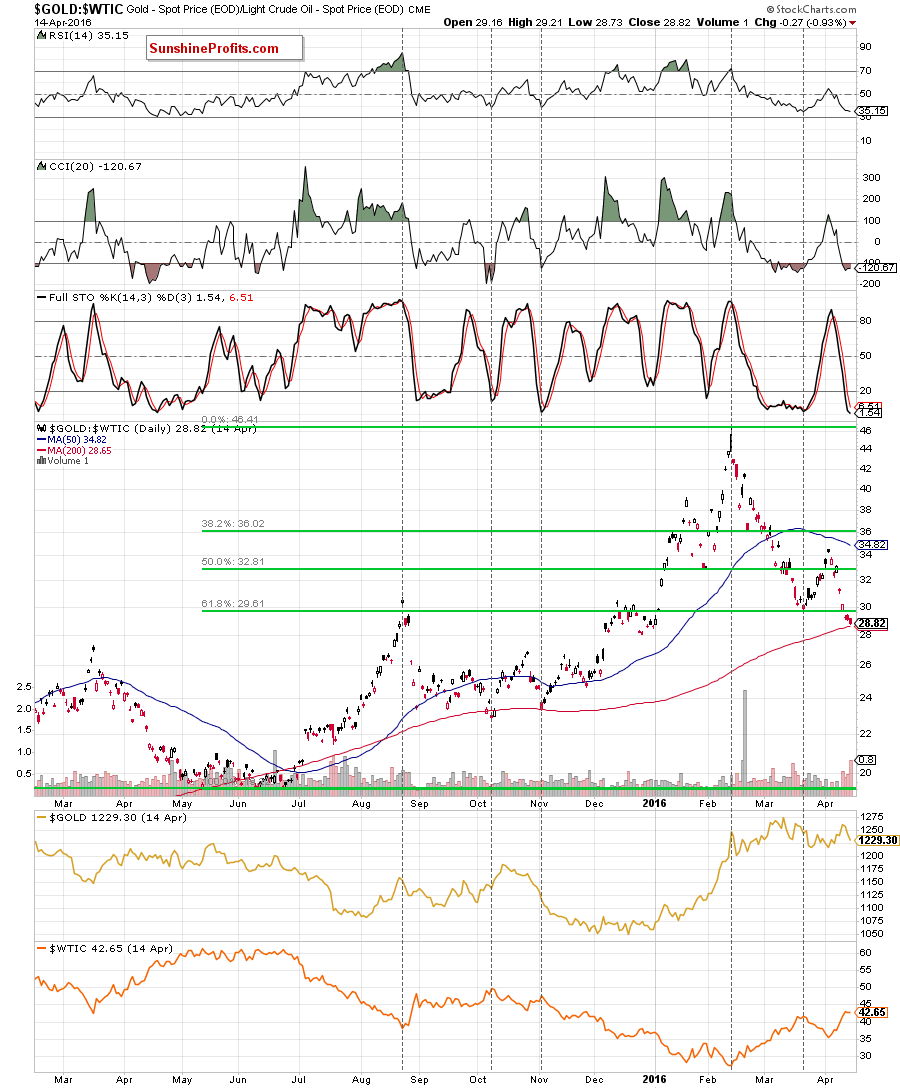
The first thing that catches the eye on the above chart is strong negative correlation between the ratio and the price of crude oil. As you see, the ratio declined to the 200-day moving average, which in combination with the current position if the CCI and Stochastic Oscillator suggests that another reversal in the coming day(s) is very likely. Why? When we examined the above chart, we noticed similar situation in Oct and Nov 2015. Back then, such combination encouraged bears to act, which translated into higher values of the ratio and declines in crude oil. Therefore, if the history repeats itself once again, we’ll likely see another downward move in light crude.
Finishing today’s alert, we would like to comment the USD/CAD chart.
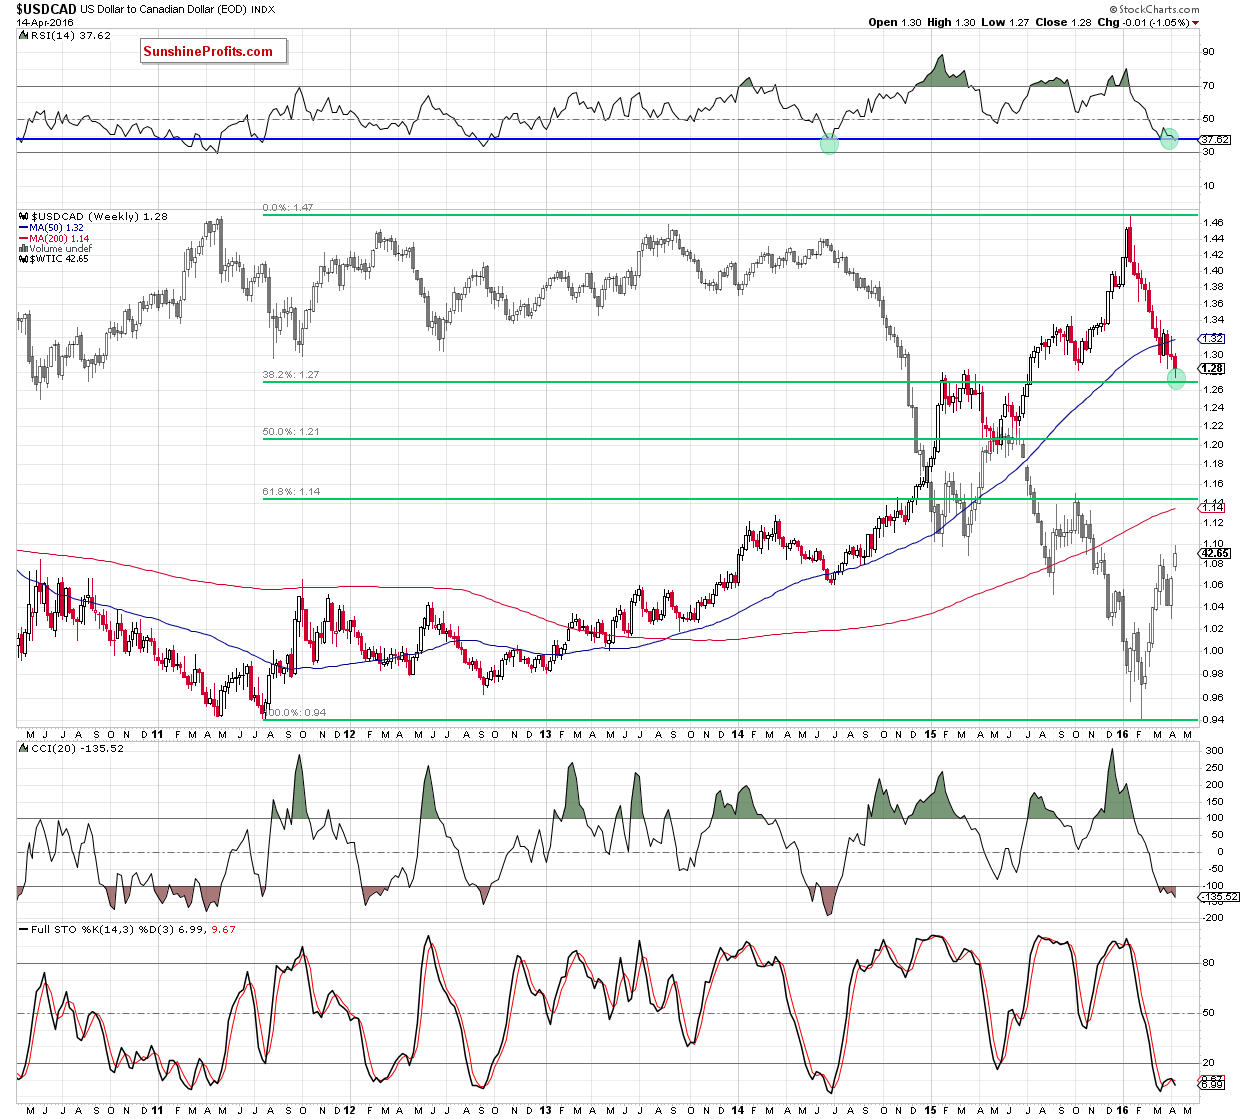
From today’s point of view, we see that USD/CAD dropped to the green support zone created by the Jan and March 2015 highs (in this area is also the 70.7% Fibonacci retracement based on May-Jan rally). Taking this fact into account, we think that reversal is just around the corner – even if the exchange rate moves lower once again and test the strength of the 38.2% Fibonacci retracement based on the entire Jul 2011-Jan 2016 upward move (around 1.2666) in the coming week. What does it mean for crude oil? As you see on the above chart, in recent months, there was strong negative correlation between USD/CAD and the price of the commodity, which suggests that reversal in this currency pair will likely correspond to reversal in crude oil.
Summing up, although crude oil closed yesterday’s session in the blue consolidation, the commodity moved lower earlier today (after the market’s open), which resulted in a drop under the March high. If light crude closes today’s session under this level, we’ll receive an invalidation of earlier small breakout (not only above the March high, but also upper border of the blue consolidation marked on the weekly chart), which would be a strong negative signal that would suggest further deterioration in the coming week - especially when we factor in the current position of daily and weekly indicators (and a potential five-wave upward move).
Very short-term outlook: mixed with berish bias
Short-term outlook: mixed with bearish bias
MT outlook: mixed
LT outlook: mixed
Trading position (short-term; our opinion): No positions are justified from the risk/reward perspective. However, if the commodity invalidates earlier breakout above the March high, we’ll consider opening short positions. We will keep you informed should anything change, or should we see a confirmation/invalidation of the above.
Thank you.
Nadia Simmons
Forex & Oil Trading Strategist
Przemyslaw Radomski, CFA
Founder, Editor-in-chief
Gold & Silver Trading Alerts
Forex Trading Alerts
Oil Investment Updates
Oil Trading Alerts

