

Trading position (short-term; our opinion): No positions are justified from the risk/reward perspective.
On Monday, crude oil lost 2.91% after Iranian Oil Minister and Russian energy minister comments. As a result, light crude invalidated earlier breakout above important resistance levels and closed the day below them. What’s next?
Yesterday, crude oil declined after the market’s open as oil investors reacted negatively to Iranian Oil Minister’s commentary. As a reminder, Bijan Zanganeh said that his country won't join a production freeze deal until Iran increases its output to 4 million barrels a day (bpd). On top of that, Russian energy minister supported the Iranian resistance against an agreement to freeze production. Alexander Novak said that Iran had the right to increase output after years of sanctions, which increased uncertainty surrounding the agreement. Thanks to these circumstances, light crude invalidated earlier breakout above important resistance levels and closed the day below them. What’s next? Let’s take a look at the charts and find out what can we infer from them (charts courtesy of http://stockcharts.com).
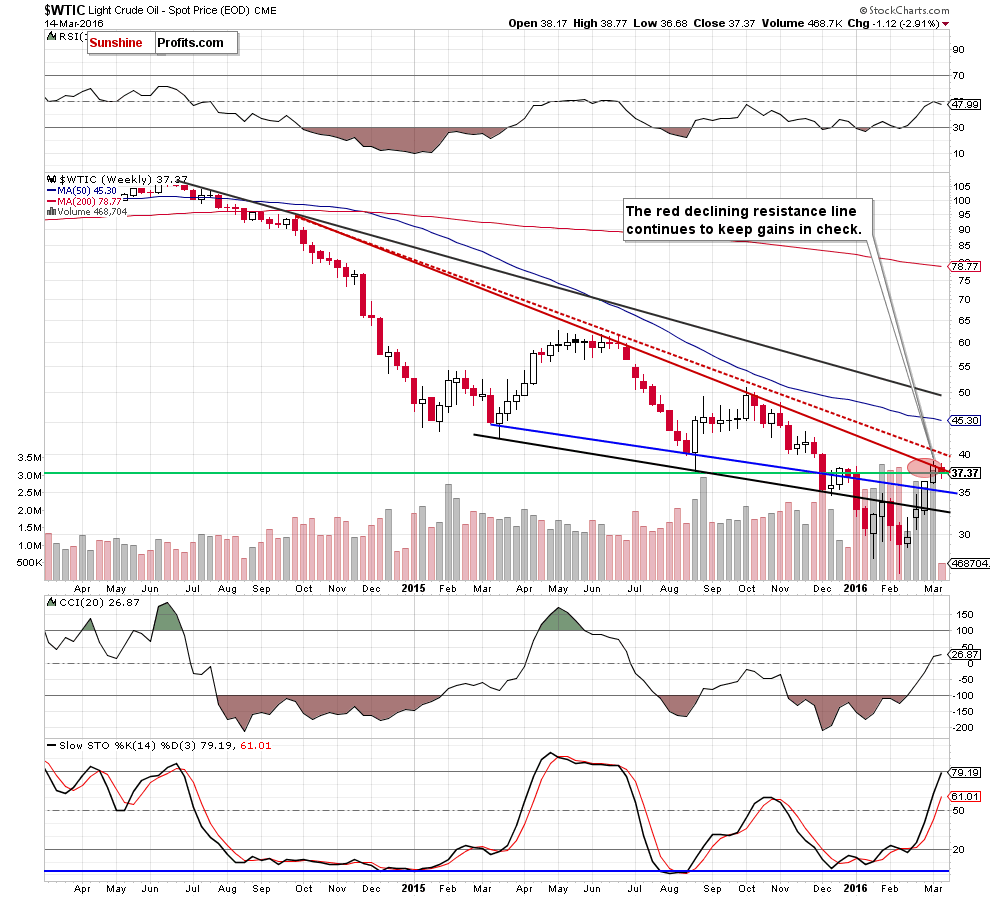
From the weekly perspective, we see that the red declining resistance line (based on the Sep 29, Jun 22 and Oct 12 weekly closing prices) encouraged oil bears to act, which resulted in an invalidation of earlier small breakout above this key resistance. This is a negative signal, which suggests further deterioration in the coming days.
What impact did this move have on the very short-term picture? Let’s check.
Quoting our previous commentary:
(…) the red resistance zone is still in play (there wasn’t daily closure above it), which in combination with the medium-term picture and the proximity to the barrier of $40 could encourage oil bears to act and trigger a downward move from here in the coming days.
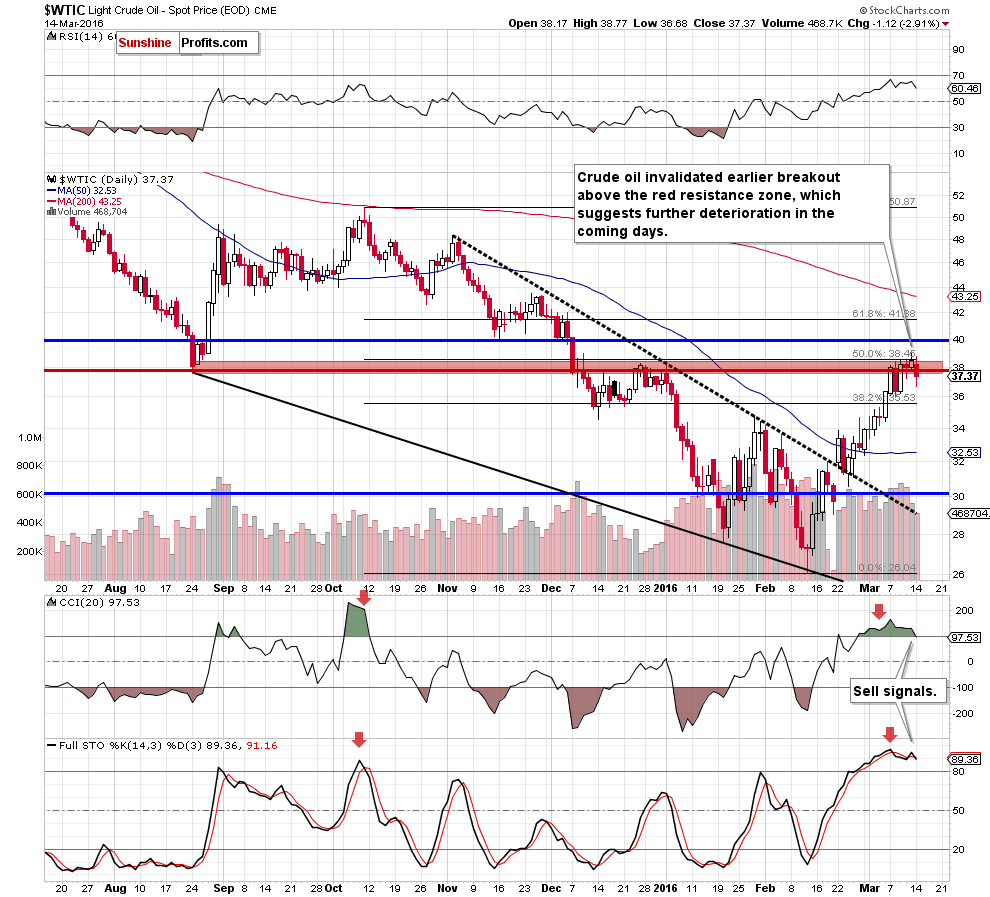
Additionally, we should keep in mind that the daily CCI and Stochastic Oscillator are overbought and there are also negative divergences between them and light crude. On top of that, when we take a closer look at the size of volume that accompanied Friday’s increase we clearly see that it was quite small (compared to the volume that we saw last Monday or Wednesday), which suggests that the bulls may weaken.
(…) it seems that crude oil will (…) erase some of recent gains later in the day. If we see such price action, the first downside target would be around $37.21, where the Mar 10 low is.
Looking at the daily chart, we see that the situation developed in line with the above scenario and crude oil moved lower as we had expected. With this downswing, light crude invalidated earlier breakout above the red resistance zone, which in combination with the medium-term picture and sell signals generated by the CCI and Stochastic Oscillator suggests further deterioration. How low could the commodity go in the coming days? In our opinion, the initial downside target would be around $35.96, where the 23.6% Fibonacci retracement (based on the entire recent upward move) is. If t is broken, we’ll likely see a drop to the next retracement (at $34.06).
Finishing today’s alert, we would like to comment the size of yesterday’s volume. Although it was quite small (which suggest at the first sight that oil bears are not strong yet), we saw similar cases in the past (for example on Oct 12, Nov 5, Dec 9, Jan 15, Feb 5). Back then, similar situation didn’t change much and oil bears showed their claws in the following days. Consequently, we don’t think that the size of yesterday’s volume has any implications. Connecting the dots, we are considering opening a short position, but we are not doing this just yet.
We expect a high volatility in the crude oil market tomorrow due to futures contracts expiration and we might be able to open short positions at more favorable prices because of that. Consequently, we are not opening such positions just yet, but are quite likely to do so tomorrow.
Summing up, the red resistance zone (marked on the daily chart) and the red resistance line (seen on the weekly chart) triggered a pullback which invalidated earlier small breakout above these levels. Additionally, indicators generated sell signals, which suggests that lower values of the commodity are more likely than not.
Very short-term outlook: bearish
Short-term outlook: bearish
MT outlook: mixed with bearish bias
LT outlook: mixed with bearish bias
Trading position (short-term; our opinion): No positions are justified from the risk/reward perspective. We will keep you – our subscribers – informed should anything change.
Thank you.
Nadia Simmons
Forex & Oil Trading Strategist
Przemyslaw Radomski, CFA
Founder, Editor-in-chief
Gold & Silver Trading Alerts
Forex Trading Alerts
Oil Investment Updates
Oil Trading Alerts

