

Trading position (short-term; our opinion): No positions are justified from the risk/reward perspective.
On Wednesday, crude oil reversed and gained 5.09% after the EIA report showed a smaller-than-expected increase in U.S. crude oil inventories (compared to the API report released late Tuesday). As a result, light crude reversed and hit a fresh March high. What’s next for the commodity?
Yesterday, the U.S. Energy Information Administration reported that crude oil inventories increased by 3.9 million barrels for the week ending on March 4 (thanks to this increase, U.S. crude oil inventories are at historically high levels for this time of year). Despite these numbers, the recent build was much smaller than a week earlier when crude stockpiles rose by more than 10 million barrels. Additionally, gasoline inventories fell by 4.5 million barrels, which encouraged oil investors to act and resulted in a fresh March high. What’s next for the commodity? Let’s take a look at the charts and find out (charts courtesy of http://stockcharts.com).
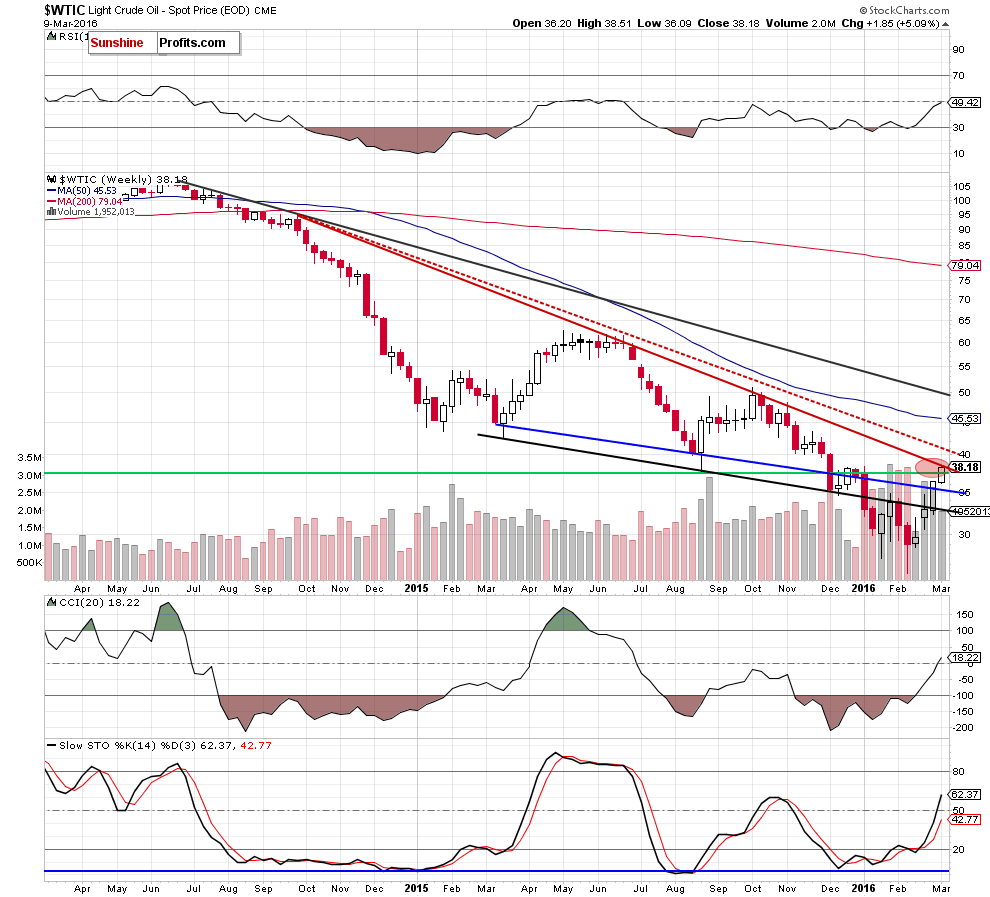
On the weekly chart, we see that although crude oil moved higher once again, the red declining resistance line (based on the Sep 29, Jun 22 and Oct 12 weekly closing prices) continues to keep gains in check.
Having said that, let’s focus on the very short-term changes.
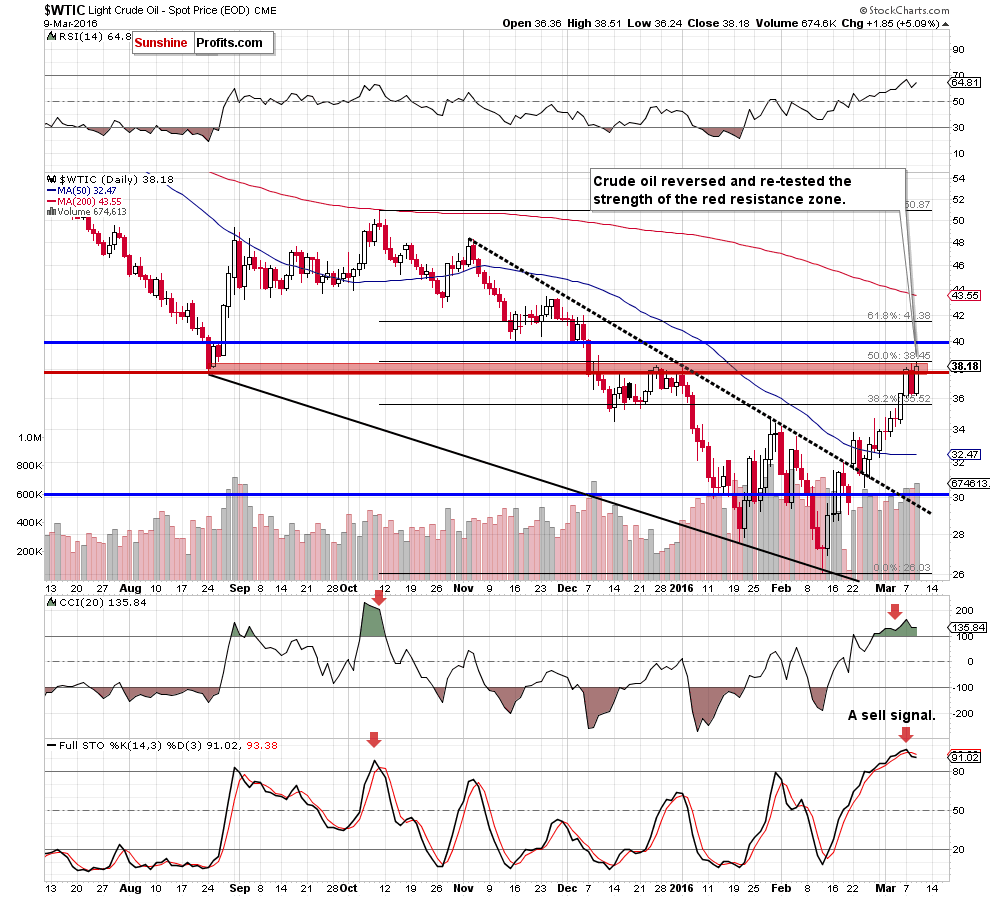
From this perspective, we see that crude oil reversed and rebounded sharply, hitting a fresh March high of $38.51. With this upswing, light crude came back above the red horizontal line (based on the Aug low), the late Dec and Jan highs and tested the strength of the 50% Fibonacci retracement (based on the Oct-Feb downward move). Although this is a positive signal, we should keep in mind that the CCI is overbought, while the sell signal generated by the Stochastic Oscillator remains in place, supporting oil bears. Additionally, the barrier of $40 is quite close, which suggests that the space for further gains may be limited and reversal is just around the corner.
Before we summarize today’s Oil Trading Alert, let’s check what impact this upswing had on the oil-to-gold ratio.
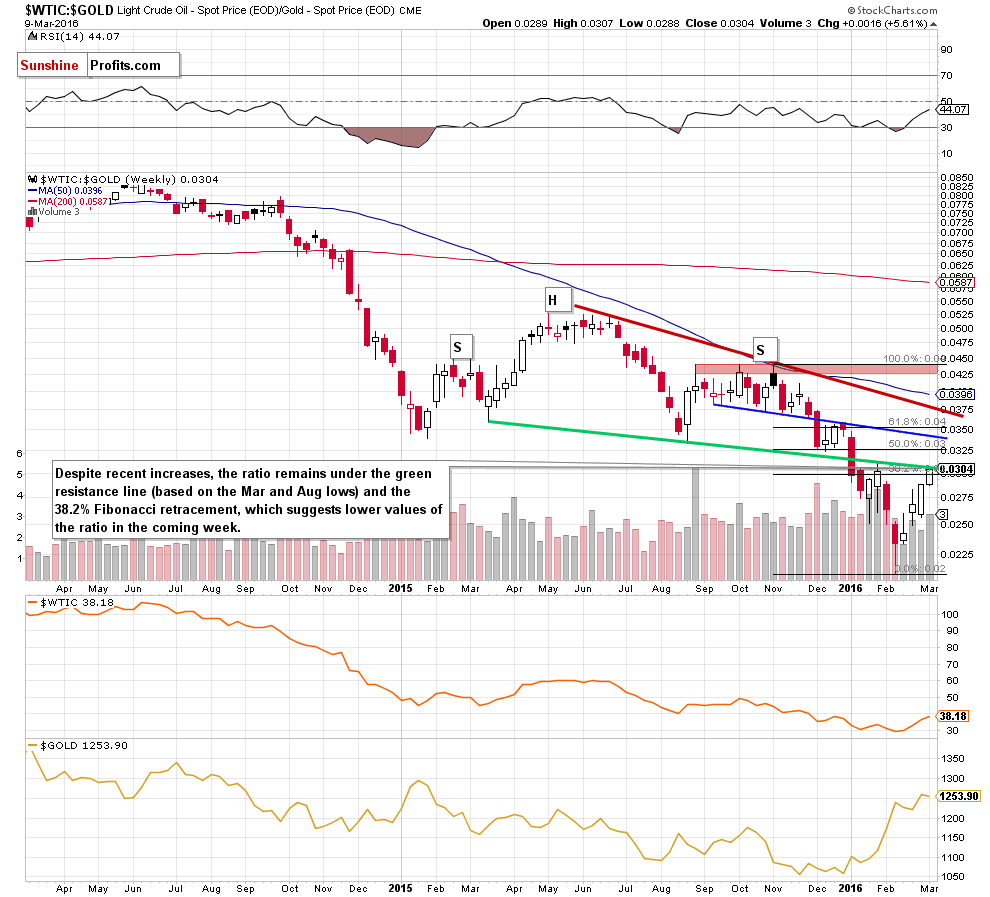
As you see on the weekly chart, although the oil-to-gold ratio moved higher once again, the green resistance line (based on the Mar and Aug lows) continues to keep gains in check, suggesting that reversal from here is very likely. Why? Because we saw similar price action in late Jan. Back then the above-mentioned resistance triggered a sharp decline in the following weeks, which increases the probability that history will repeat itself once again and we’ll see lower values of the ratio (and crude oil) in the coming week(s).
Summing up, crude oil reversed and re-tested the strength of the red resistance zone (marked on the daily chart) and the red resistance line (seen on the weekly chart). Despite this increase, the current position of the indicators and the oil-to-gold ratio suggests that reversal and lower values of the commodity are just around the corner (especially when we factor in the proximity to the psychologically important barrier of $40).
Very short-term outlook: mixed with bearish bias
Short-term outlook: mixed with bearish bias
MT outlook: mixed
LT outlook: mixed
Trading position (short-term; our opinion): No positions are justified from the risk/reward perspective. We will keep you – our subscribers – informed should anything change.
Thank you.
Nadia Simmons
Forex & Oil Trading Strategist
Przemyslaw Radomski, CFA
Founder, Editor-in-chief
Gold & Silver Trading Alerts
Forex Trading Alerts
Oil Investment Updates
Oil Trading Alerts

