

Trading position (short-term; our opinion): Short positions with a stop-loss order at $54.12 and initial (!) target price at $35.72 are justified from the risk/reward perspective.
Although the Energy Information Administration showed in its weekly report another build in U.S. crude inventories, disappointing U.S. import-export data weakened the greenback, making crude oil cheaper. Thanks to these circumstances, light crude oil rebounded sharply and gained 3.67%, climbing to an intraday high of $46.04. But did this one-day rally change anything in a broader perspective?
Yesterday, the EIA reported that U.S. crude oil inventories rose by 2.6 million barrels for the week ending on September 4, missing expectations for a 1.0 million build. On top of that, gasoline inventories increased by 0.4 million barrels, while distillate fuel inventories rose by 1.0 million barrels for the week. Despite these bearish numbers, crude oil rebounded sharply and increased to $46 as a weaker U.S. dollar supported the price (as a reminder, yesterday, the U.S. Bureau of Labor Statistics showed that U.S. import prices fell by 1.9% in August, while export prices declined by 1.4% - far below expectations for a 0.4% drop). Did this drop change the short-term picture of the commodity? Let’s check (charts courtesy of http://stockcharts.com).
Quoting our previous commentary:
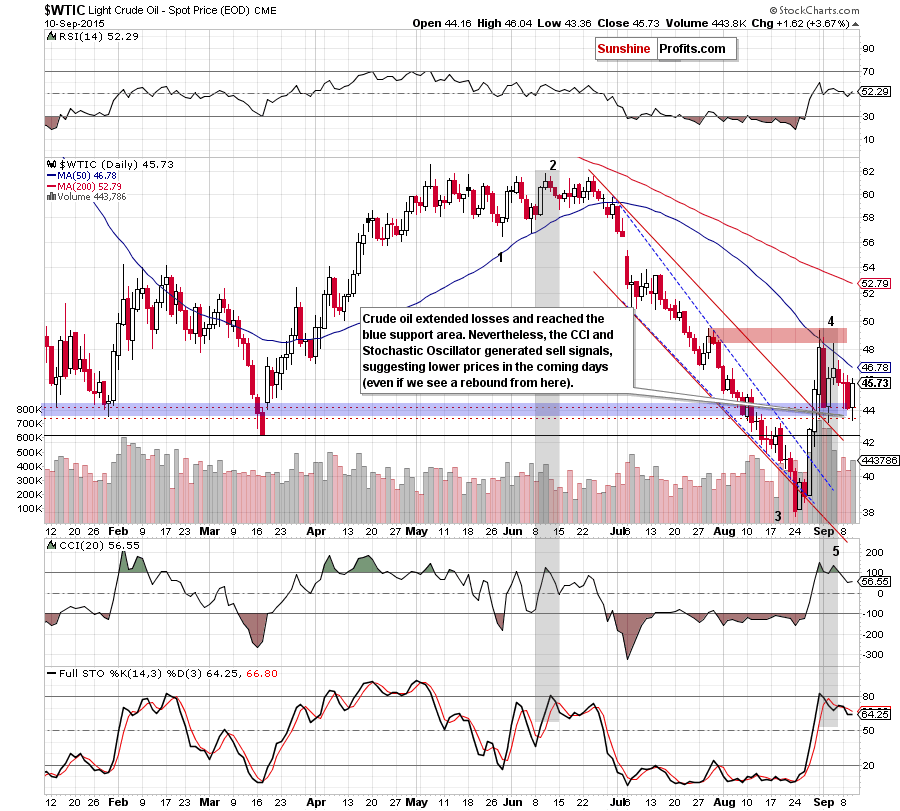
(…) crude oil extended losses and reached the blue support zone (based on the Jan lows) and the previously-broken black support line (based on Jan and Mar weekly closing prices), which could trigger a rebound from here – similarly to what we saw in the previous week.
Looking at the daily chart, we see that the situation developed in line with the above scenario and light crude moved sharply higher yesterday. But did this one-day rally change anything in the short-term picture? Not really. The reason? As you see on the daily chart, despite yesterday’s move, the commodity remains under the 50-day moving average. Additionally, this upswing didn’t materialize on huge volume (compared to what we saw in the previous week), which suggests that oil bulls may be not as strong as it seems at the first glance. On top of that, sell signals generated by the CCI and Stochastic Oscillator remain in place, supporting oil bears and suggesting lower prices in the coming days.
Having said that, let’s check what impact did yesterday’s rally have on the medium-term picture.
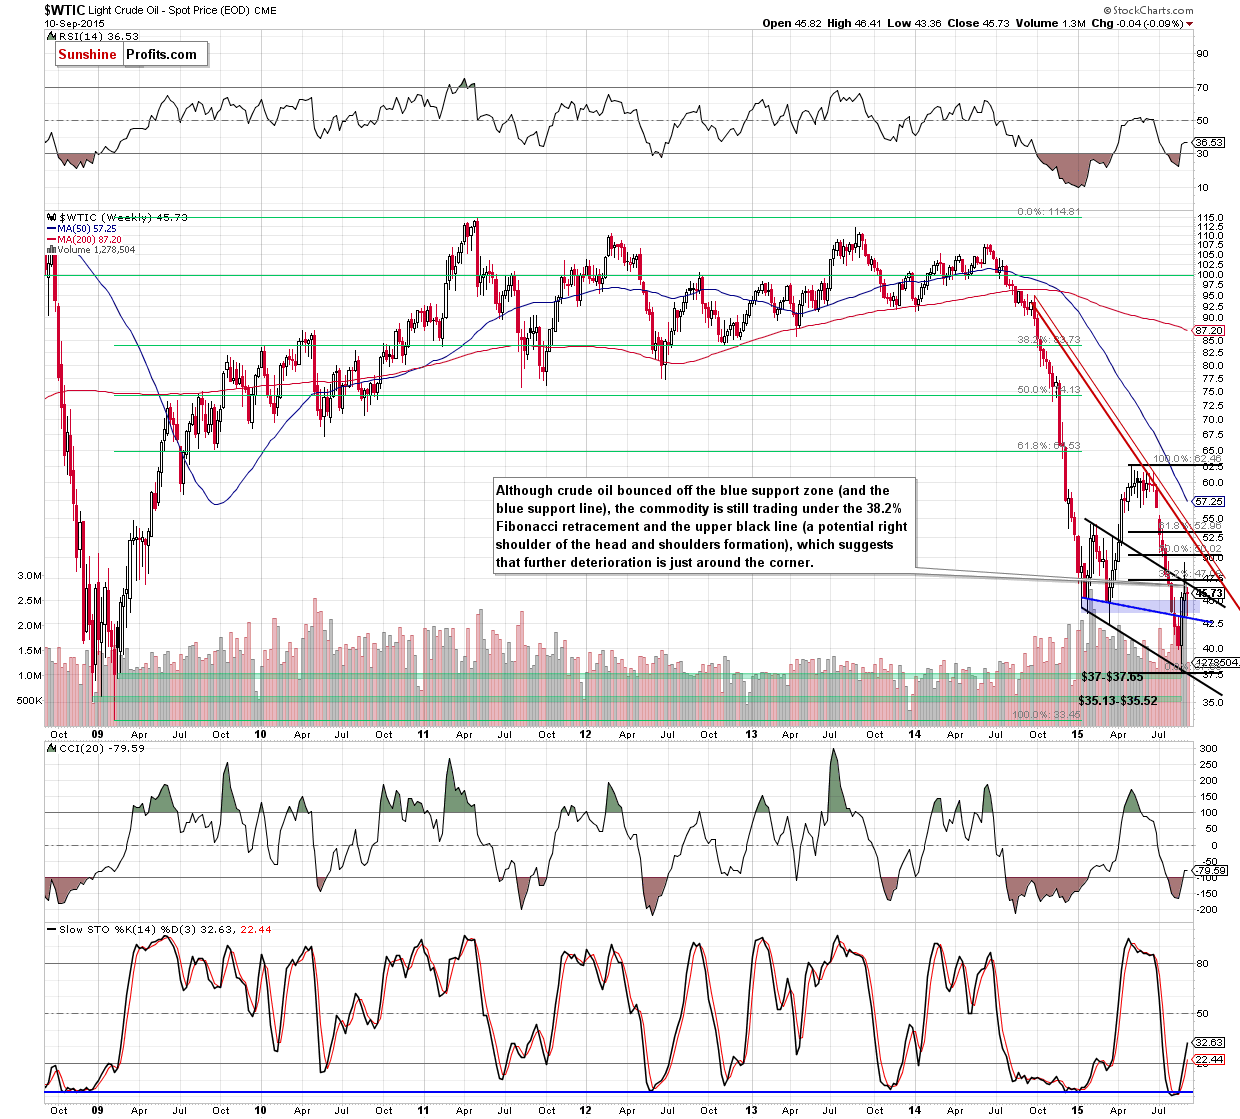
From this perspective, we see that although crude oil bounced off the blue support zone (reinforced by the blue support line), the commodity is still trading under the 38.2% Fibonacci retracement level and the upper black line (a potential right shoulder of the head and shoulders formation), which suggests that further deterioration is just around the corner.
How low could the commodity go in the coming weeks? We believe that the best answer to this question will be the quote from our Oil Trading Alert posted a week ago:
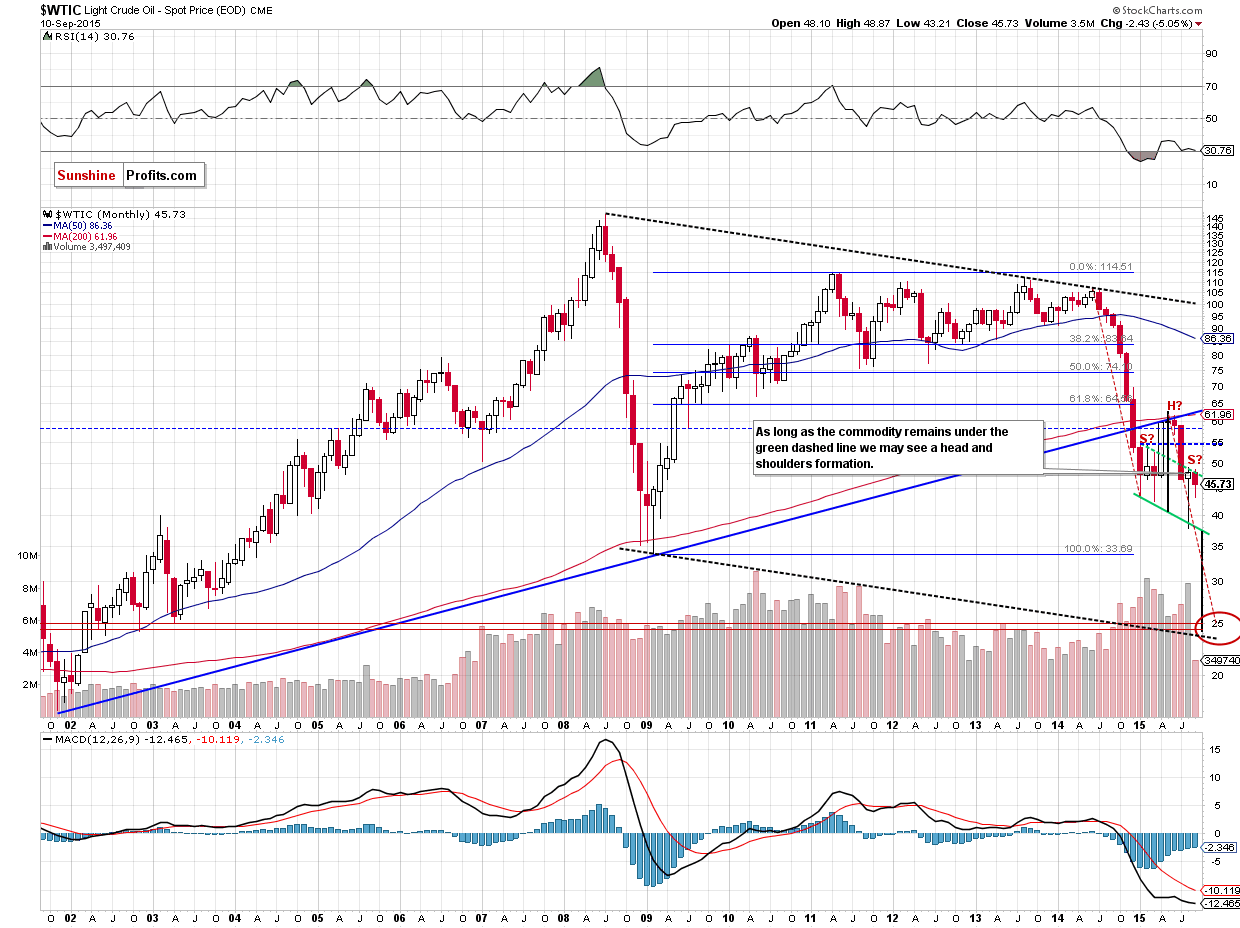
(...) it seems quite likely that crude oil will slide all the way down to more or less $25 dollars and there are multiple reasons for it:
- The breakdown below the key long-term rising support line (marked with blue) was confirmed and verified – this year’s rally didn’t take crude oil back above it – the line proved to be strong resistance. This by itself doesn’t imply a target level at a certain point, but it strongly suggests that crude oil has to fall much lower, before the decline is over.
- The symmetry of major declines: the 2008 slide is the only decline that is really similar to the current one, and in order for this similarity to be upheld (history repeats itself to a considerable extent), crude oil would have to move even a bit below $25. On the above chart you can see that in the form of the declining dashed black lines.
- The symmetry between the 2014 slide and the (likely) current decline. This year we have definitely seen some kind of consolidation (which might still turn out to be a bottom, but that is unlikely in our view) and the move that follows a consolidation is very often similar to the one that preceded it. If you look at the red dashed declining lines on the above chart you’ll notice that for the previous decline to repeat, crude oil would have to move to about $25.
- Speaking of the consolidation, it’s taking the form of a head-and-shoulders pattern and once / if the pattern is completed, we will have a pattern-based target at around $25. The reason is that once price breaks below the “neck level”, it’s likely to decline as much as the size of the “head” in the pattern.
- The late-2002 and 2003 bottoms create strong support at those levels.
The amount of signals that points to $25 as the most likely target is uncanny, which makes it quite reliable.
Yes, there also are the 2008 and 2009 lows, but generally not much (if anything) confirms them as a major target, so they might not be able to generate anything more than a short-lived bounce (if anything at all).
We would like to stress that the above is what we believe as most likely based on today’s prices and it can change in the following days or weeks. Of course we’ll keep you – our subscribers – updated.
Summing up, although crude oil moved higher, the size of the volume that accompanied yesterday’s rally didn’t confirm oil bulls’ strength. On top of that, the medium-term outlook for the black gold remains bearish as the commodity remains under the 50-day moving average, the 38.2% Fibonacci retracement and the upper black resistance line (marked on the weekly chart). Therefore, we believe that short positions (which are already profitable as we entered them when crude oil was at about $46.68) continue to be justified from the risk/reward point of view.
Very short-term outlook: bearish
Short-term outlook: bearish
MT outlook: bearish
LT outlook: mixed with bearish bias
Trading position (short-term; our opinion): Short positions with a stop-loss order at $54.12 (yes, that far as the medium-term outlook is unlikely to change as long as crude oil stays below the declining medium-term resistance line) and initial (!) target price at $35.72 are justified from the risk/reward perspective. We will keep you – our subscribers – informed should anything change.
Thank you.
Nadia Simmons
Forex & Oil Trading Strategist
Przemyslaw Radomski, CFA
Founder, Editor-in-chief
Gold & Silver Trading Alerts
Forex Trading Alerts
Oil Investment Updates
Oil Trading Alerts

