

Trading position (short-term; our opinion): Short positions with a stop-loss order at $65.23 are justified from the risk/reward perspective.
On Thursday, crude oil 1.36% as a stronger greenback continued to weigh on the price. As a result, light crude closed the session below $51 and at the lowest level since Apr. Will oil bears break below the barrier of $50 in the coming days? Let’s examine interesting ratios and find out.
Yesterday, the U.S. Department of Labor reported that the number of initial jobless claims in the week ending July 11 dropped by 15,000, beating analysts’ expectations for a 10,000 decline. Hanks to these bullish numbers, the USD Index extended gains and hit a one-and-a-half month high of 97.92, making crude oil less attractive for buyer holding other currencies. As a result, light crude reversed and declined, finishing the day at its lowest level since Apr (the last daily close below $51 we saw on Apr 9). Does it mean that we’ll finally see a decline below the barrier of $50 in the coming days? (charts courtesy of http://stockcharts.com).
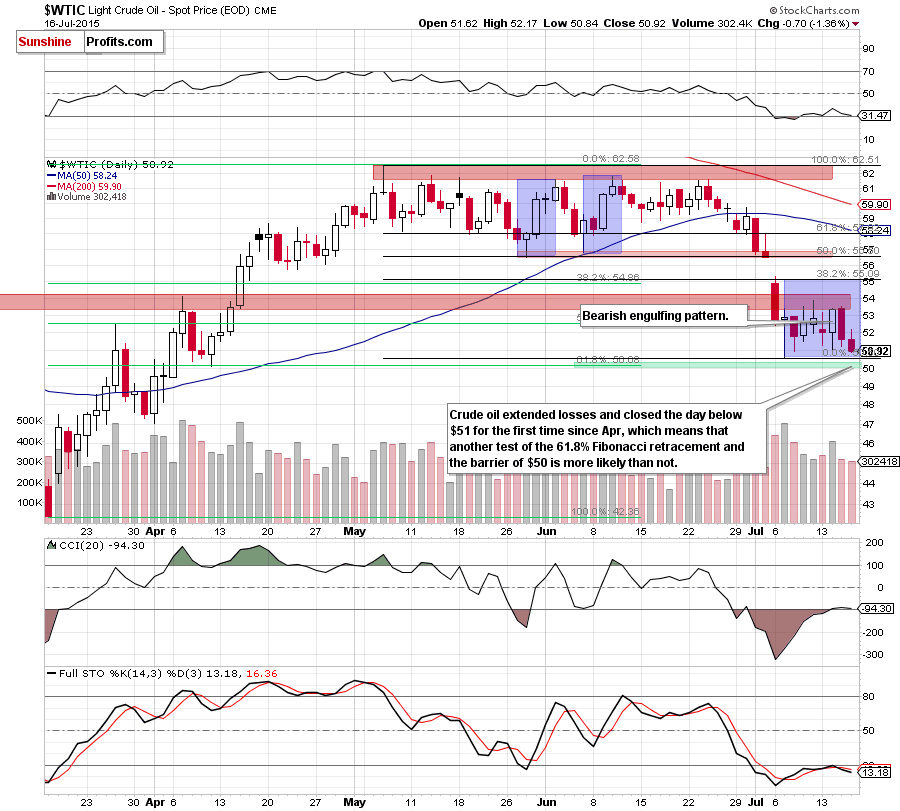
Looking at the daily chart, we see that crude oil extended losses (making short positions even more profitable) and broke below the Wednesday’s low. Additionally, the commodity closed the day below $51, which means that another test of the 61.8% Fibonacci retracement and the barrier of $50 is more likely than not (especially if today’s Baker Hughes report shows another increase in the number of U.S. oil rig count).
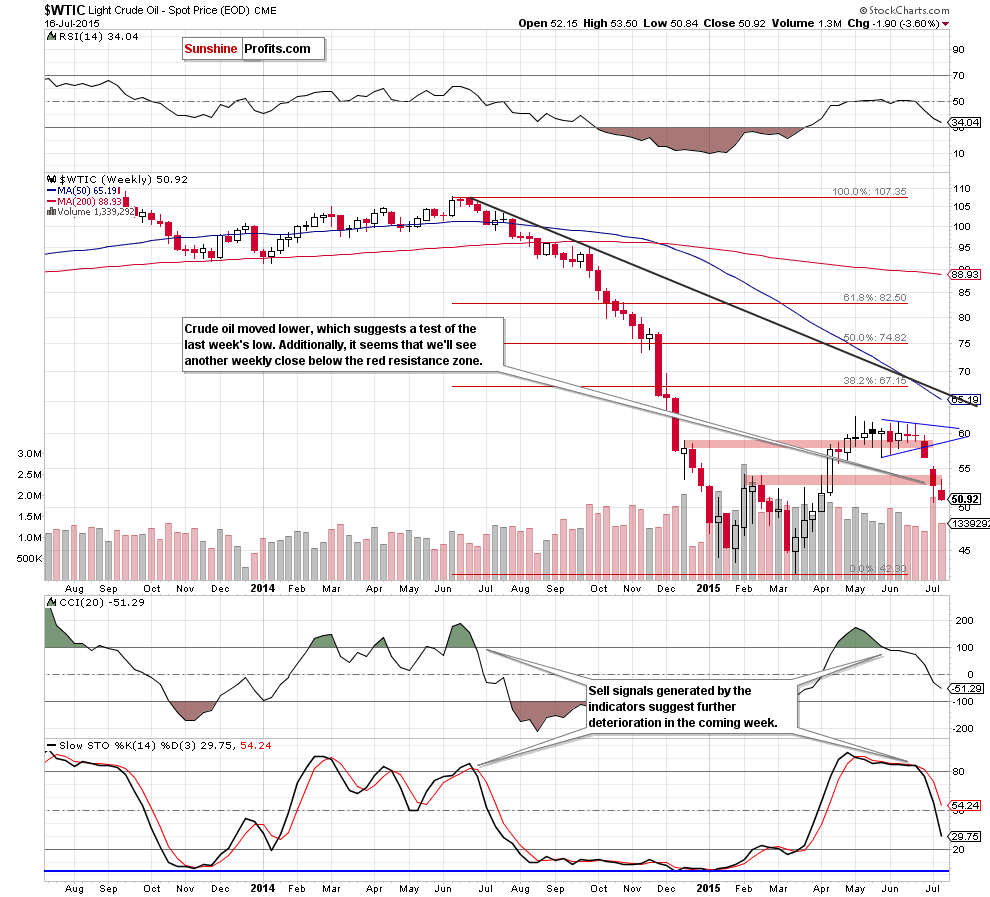
Taking this fact into account, and combining it with sell signals generated by the weekly indicators, we believe that our previous commentary is up-to-date:
(…) the short-term downward trend remains in place (…) although the following decline doesn’t have to cut crude oil’s price in half once again, it does seem that the current decline has only begun.
(…) Nevertheless, in our opinion, another acceleration of declines will be more likely if light crude closes the day under the psychologically important barrier of $50 and the 61.8% Fibonacci retracement.
Will we see such deterioration? To have a better and more reliable answer to this question we decided to analyze the current situation in our interesting ratios. What are they saying about crude oil’s future moves? Let’s check.
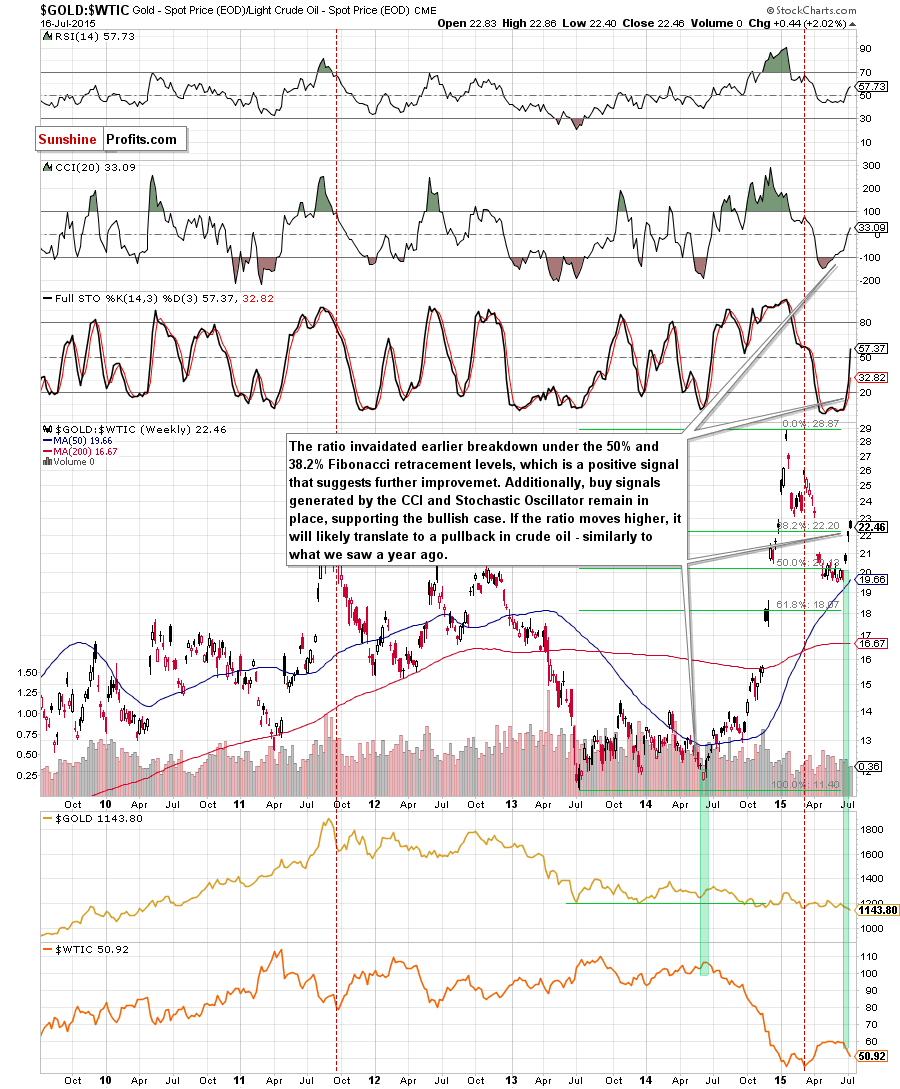
Looking at the above chart, we see that the gold-to-oil ratio bounced off the 50-week moving average and rebounded sharply, invalidating earlier breakdown below the 50% and 38.2% Fibonacci retracement levels. This is a positive signal, which suggests further improvement – especially when we factor in buy signals generated by the indicators. What does is mean for the commodity? A year ago, rallying ratio triggered a sharp decline in crude oil, which means that if the ratio extends gains, we’ll see further deterioration in the commodity.
Having said that, let’s find out whether we can infer something more about future crude oil’s moves from the stocks-to-oil ratio or not.
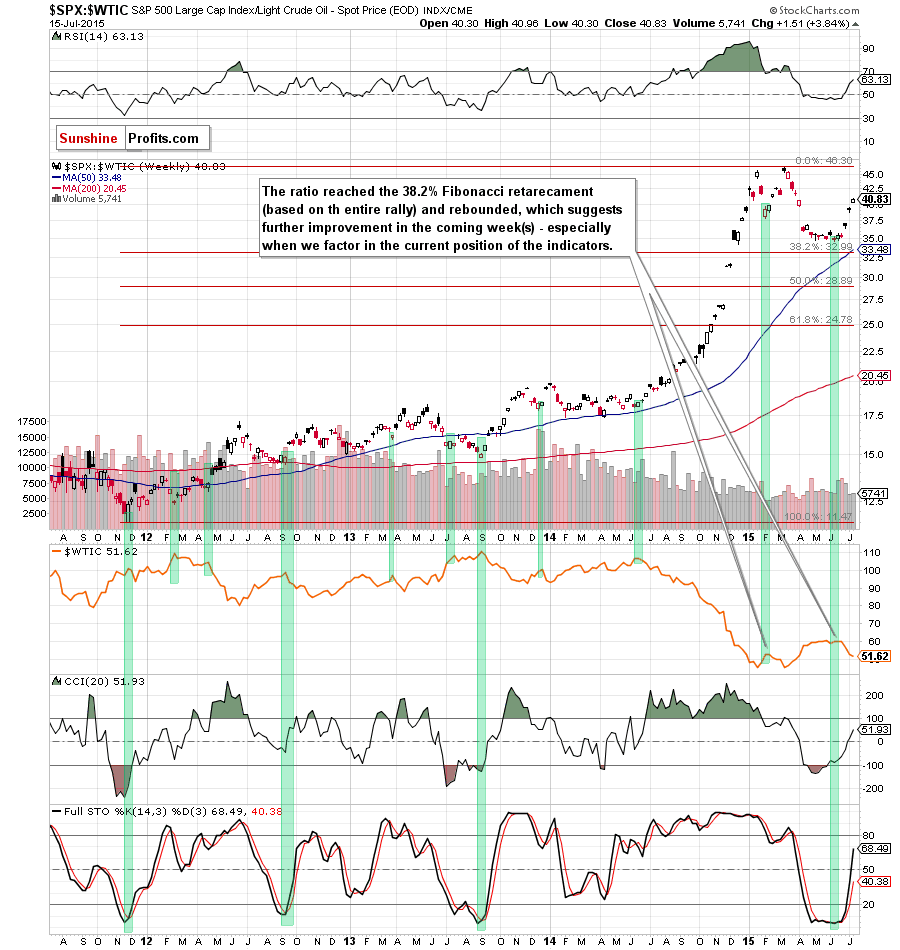
As you see on the above chart, many times in the past (we marked them with green) local bottoms in the ratio have corresponded to local tops in crude oil. Therefore, when the ratio bounced off the 38.2% Fibonacci retracement (based on the entire rally) and moved sharply higher, we saw a decline in crude oil. Taking this fact into account, and combining it with buy signals generated by the indicators, we think that higher values of the ratio (and further declines in light crude) are just around the corner.
Is it possible that the reverse of the ratio give us any valuable clues about future moves? Let’s check.
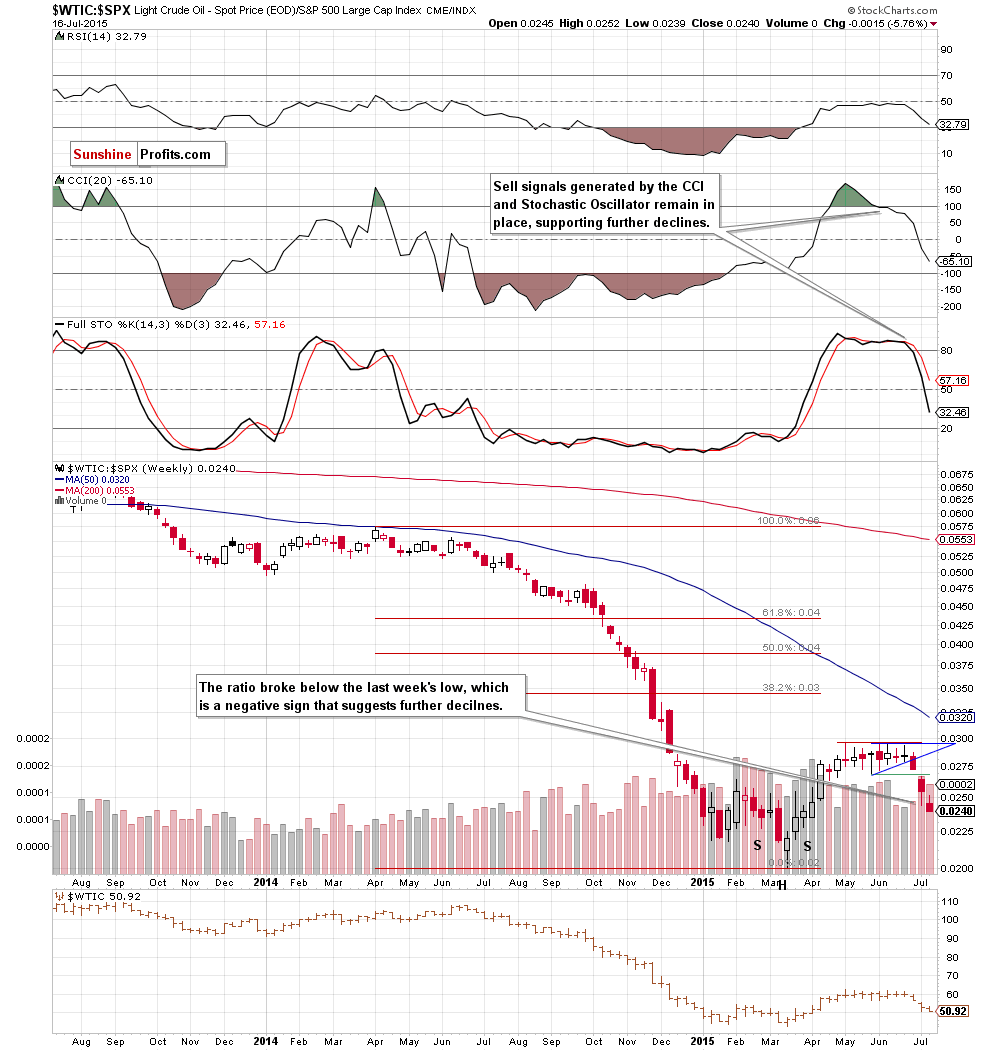
The first thing that catches the eye on the above chart is a breakdown below the last week’s low. This is a bearish signal, which suggests that lower values of light crude in the coming week(s) are more likely than not.
Summing up, short positions in crude oil are justified from the risk/reward perspective as the commodity declined sharply and closed the session at its lowest level since Apr 9. This confirms that the downtrend remains in place, suggesting lower values of the commodity in the coming days (especially when we factor in sell signals and the current position of the above-mentioned ratios).
Very short-term outlook: bearish
Short-term outlook: bearish
MT outlook: mixed with bearish bias
LT outlook: mixed with bearish bias
Trading position (short-term; our opinion): Short positions with a stop-loss order at $65.23 are justified from the risk/reward perspective. We will keep you – our subscribers – informed should anything change.
Thank you.
Nadia Simmons
Forex & Oil Trading Strategist
Przemyslaw Radomski, CFA
Founder, Editor-in-chief
Gold & Silver Trading Alerts
Forex Trading Alerts
Oil Investment Updates
Oil Trading Alerts

