

Trading position (short-term; our opinion): Short positions with a stop-loss order at $65.23 are justified from the risk/reward perspective.
On Tuesday, crude oil gained 4.02% as a weaker greenback and hopes that the API report will show another drop in domestic crude oil inventories supported the price. As a result, light crude climbed above $60 and broke above the short-term resistance line. How high could the commodity go in the coming days?
On Friday, the Baker Hughes report showed that the number of rigs drilling for oil in the U.S. fell once again (only by 4, but still). This 26th straight week of declines fueled hopes that the American Petroleum Institute’s report would show another drop in domestic inventories and supported the price of light crude. Additionally, the USD Index move lower, making crude oil more attractive for buyers holding other currencies. In this environment, light crude moved sharply higher, breaking above the short-term resistance line. How high could the commodity go in the coming days? (charts courtesy of http://stockcharts.com).
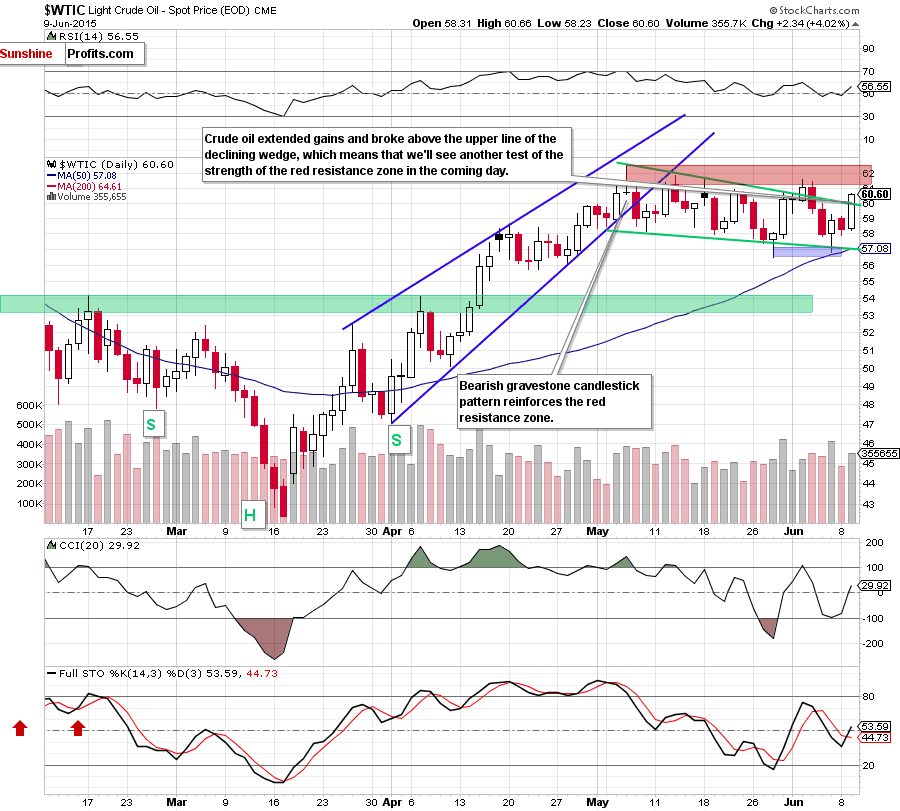
Yesterday, crude oil reversed once again and broke above the upper border of the declining wedge, which means that we’ll likely see another test of the strength of the red resistance zone (created by the May highs and reinforced by a bearish gravestone candlestick pattern) later in the day. At this point, it is worth noting that we saw similar price action in the previous week. Back then, the above-mentioned resistance area was strong enough to stop further rally, which suggests that we might see another pullback from there in the coming day(s).
Did yesterday’s upswing change the long-term picture of the commodity?
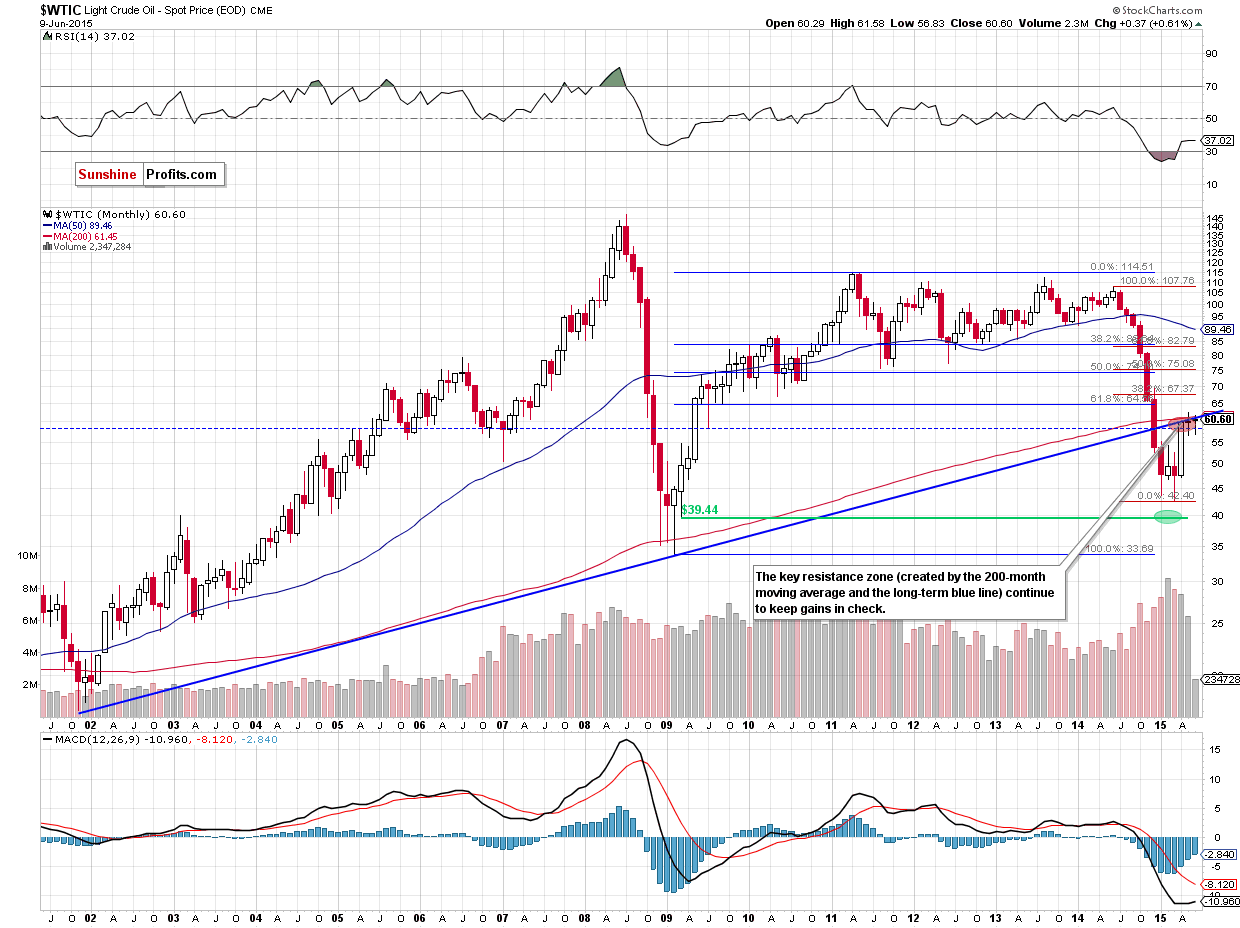
Not really. As you see on the monthly chart, although crude oil reversed and moved higher once again, the key resistance zone (created by the long-term blue resistance line and the 200-month moving average) continues to keep gains in check. Therefore, we believe that as long as there is no successful breakout above this area further rally is not likely to be seen and anoher downswing is more likely than not.
Finishing today’s alert please note that the American Petroleum Institute reported that crude oil inventories dropped by 6.7 million barrels and gasoline inventories sank 3.9 million barrels in the previous week. If today’s EIA report confirms these numbers, we’ll see another test of the long-term blue resistance line and the 200-month moving average.
Summing up, although crude oil moved sharply higher and broke above the upper line of the declining wedge, we believe that the red resistance area in combination with the key resistance zone (created by the 200-month moving average and the long-term blue line) will encourage oil bears to act in the coming day(s).
Very short-term outlook: bearish
Short-term outlook: bearish
MT outlook: mixed with bearish bias
LT outlook: mixed with bearish bias
Trading position (short-term; our opinion): Short positions with a stop-loss order at $65.23 are justified from the risk/reward perspective. We will keep you – our subscribers – informed should anything change.
Thank you.
Nadia Simmons
Forex & Oil Trading Strategist
Przemyslaw Radomski, CFA
Founder, Editor-in-chief
Gold & Silver Trading Alerts
Forex Trading Alerts
Oil Investment Updates
Oil Trading Alerts

