

Trading position (short-term; our opinion): Short positions with a stop-loss order at $65.23 are justified from the risk/reward perspective.
On Thursday, crude oil gained 0.62% as domestic crude oil inventories dropped more than expected. A weaker greenback supported the price as well. Thanks to these circumstances, light crude invalidated an intraday breakdown below the key support line, but does it change anything?
Yesterday, the U.S. Energy Information Administration showed in its weekly report that U.S. crude oil inventories declined by 2.8 million barrels in the week ended May 22, compared to expectations for a drop of 0.9 million barrels. Additionally, supplies at Cushing, Oklahoma dropped by 433,000 barrels last week. This positive news in combination with a weaker greenback supported the price, which resulted in an invalidation of the intraday breakdown below the key support line. What impact could it have on future price moves? (charts courtesy of http://stockcharts.com).
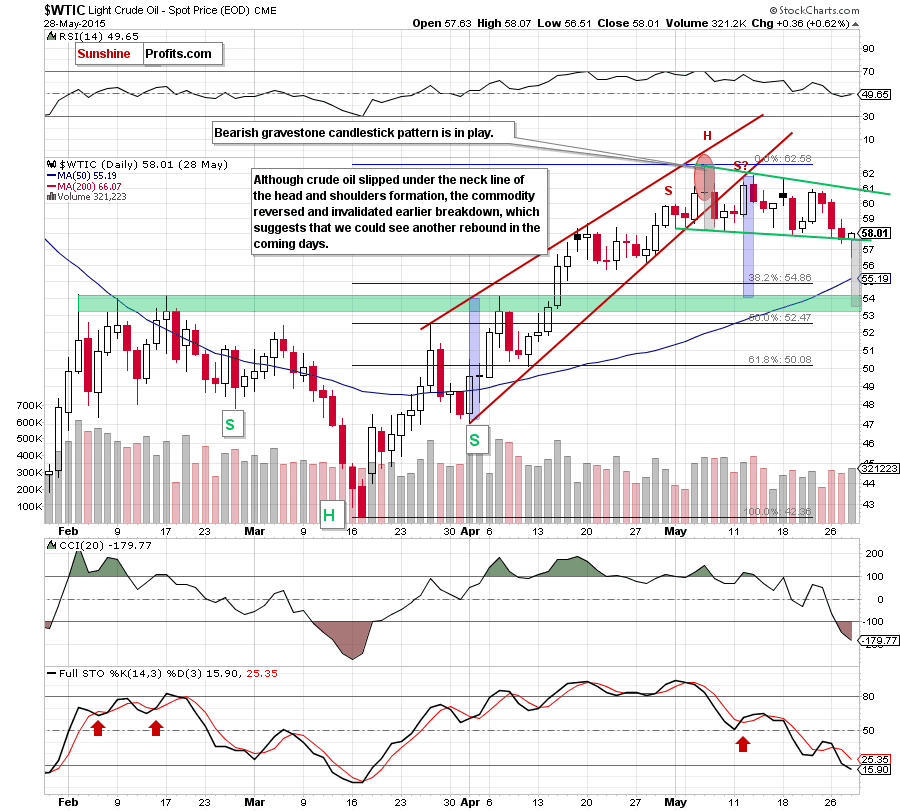
Yesterday, after the market’s open, crude oil declined below the neck line of the head and shoulders formation. Despite this deterioration, the commodity reversed and rebounded in the following hours, invalidating earlier breakdown. Although this is a positive signal, which suggests further improvement (even to the upper line of the green resistance line), we should keep in mind that sell signals generated by the indicators remain in place, supporting the bearish case.
On top of that, the picture, which emerges from the long- and medium-term charts doesn’t bode well for crude oil. Why? Let’s take a look at the charts below and find out.
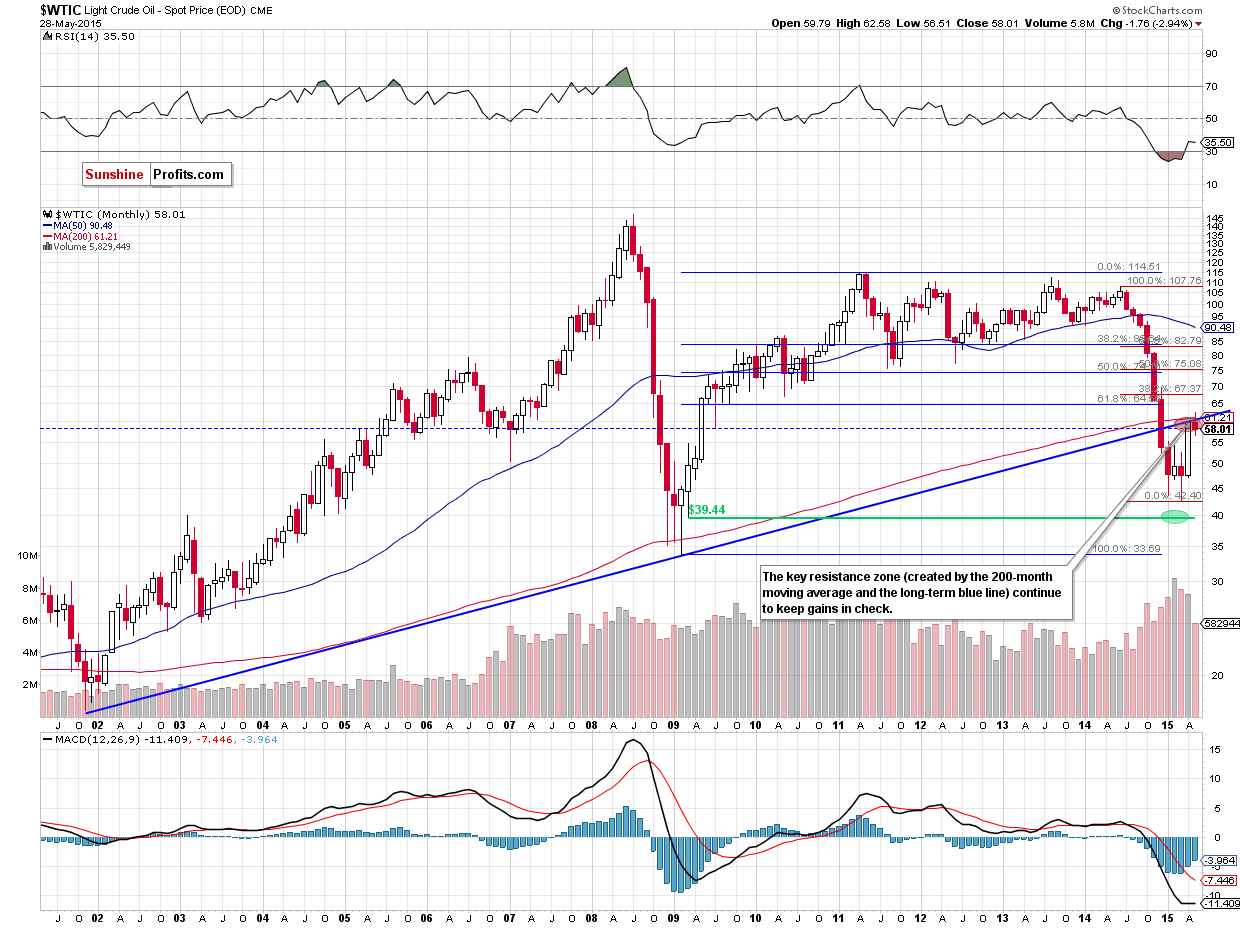
From the long-term perspective we see that yesterday’s uswing is barely visible and the commodity is trading below the key resistance line (created by the long-term blue resistance line and the 200-month moving average), which means that as long as there is no successful breakout above this area further rally is not likely to be seen and further deterioration is more likely than not.
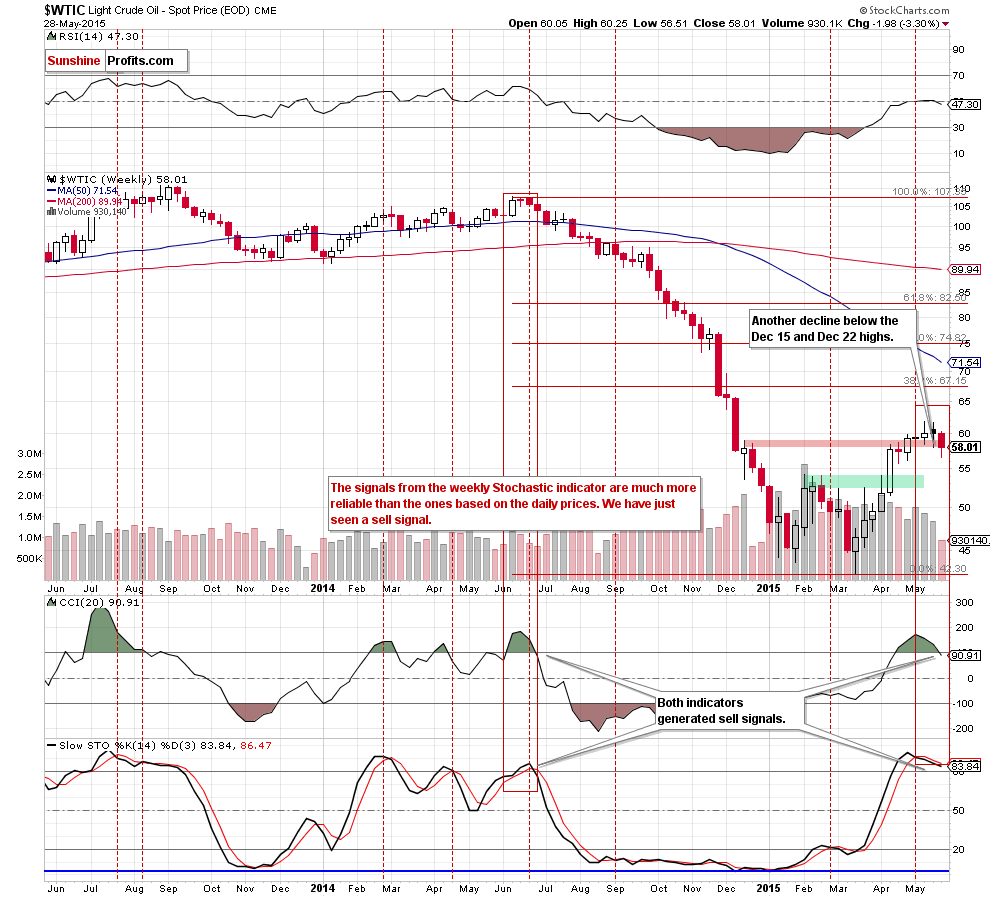
On the weekly chart, we see that invalidation of the breakout above the Dec 15 and Dec 22 highs and its negative impact on future moves is in effect, which in combination with sell signals generated by the indicators suggests further declines in the coming week.
Summing up, although crude oil declined below the neck line of the head and shoulders formation, the commodity reversed and invalidated earlier breakdown. This is a positive signal, which suggests that we could see another attempt to move higher. Nevertheless, we believe that even light crude moves higher from here, the space for further gains is limited and a breakdown below the neck line of the formation is only a matter of time (especially when we factor in sell signals generated by the weekly indicators).
Very short-term outlook: bearish
Short-term outlook: bearish
MT outlook: mixed with bearish bias
LT outlook: mixed with bearish bias
Trading position (short-term; our opinion): Short positions with a stop-loss order at $65.23 are justified from the risk/reward perspective. We will keep you – our subscribers – informed should anything change.
Thank you.
Nadia Simmons
Forex & Oil Trading Strategist
Przemyslaw Radomski, CFA
Founder, Editor-in-chief
Gold & Silver Trading Alerts
Forex Trading Alerts
Oil Investment Updates
Oil Trading Alerts

