

Trading position (short-term; our opinion): Short positions with a stop-loss order at $65.23 are justified from the risk/reward perspective.
On Tuesday, crude oil lost 2.73% as a stronger greenback weighed on the price. As a result, light crude declined to the key support line for the third time this month. Will we see another rebound? Or maybe this time oil bears will manage to push the commodity lower?
Yesterday, the USD Index extended gains and hit a 4-week high as Friday’s Janet Yellen commentary (that the bank still expects to start raising interest rates later this year) continued to support the greenback. A stronger U.S. dollar made crude oil less attractive for buyers holding other currencies, which resulted in a sharp decline to the key support line. Will it withstand the selling pressure in the coming days? (charts courtesy of http://stockcharts.com).
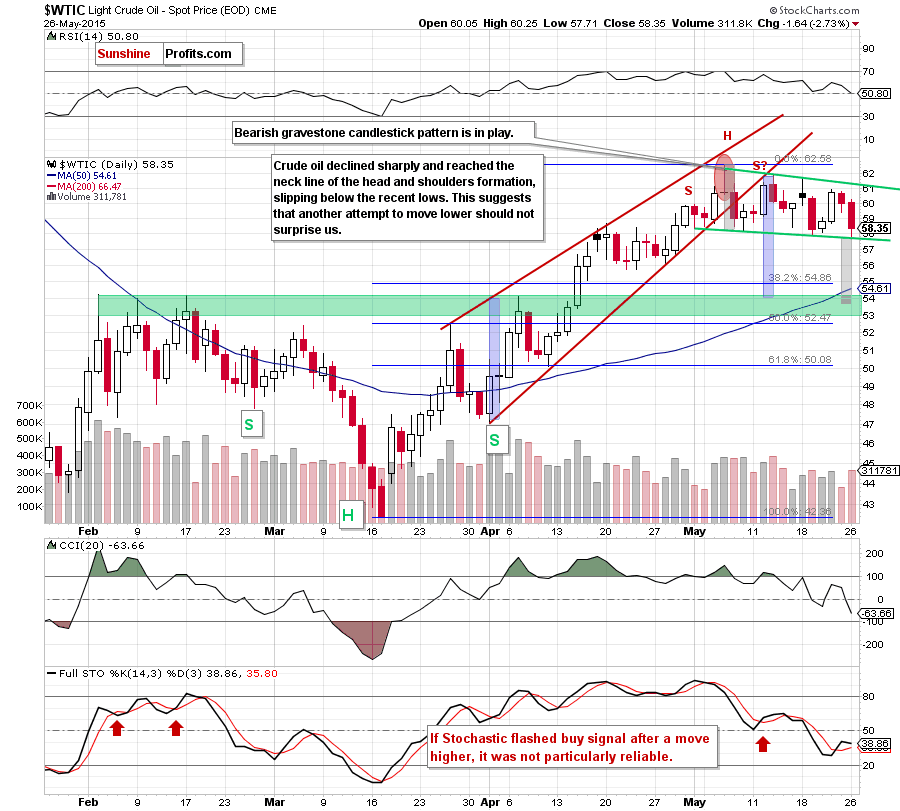
As you see on the daily chart, although crude oil climbed above $60 after the market’s open, the commodity reversed and declined sharply in the following hours. With this downswing, light crude reached the neck line of the head and shoulders formation once again (the third time this month). In all previous cases, this support line was srong enough to stop further declines and trigger upswings, which suggests that we could see similar price action in the coming day(s). Nevertheless, we think that even if we see a rebound from here, the space for growth is limited by the green resistance line (the upper line of the declining trend channel) and the major resistance zone marked on the monthly chart below.
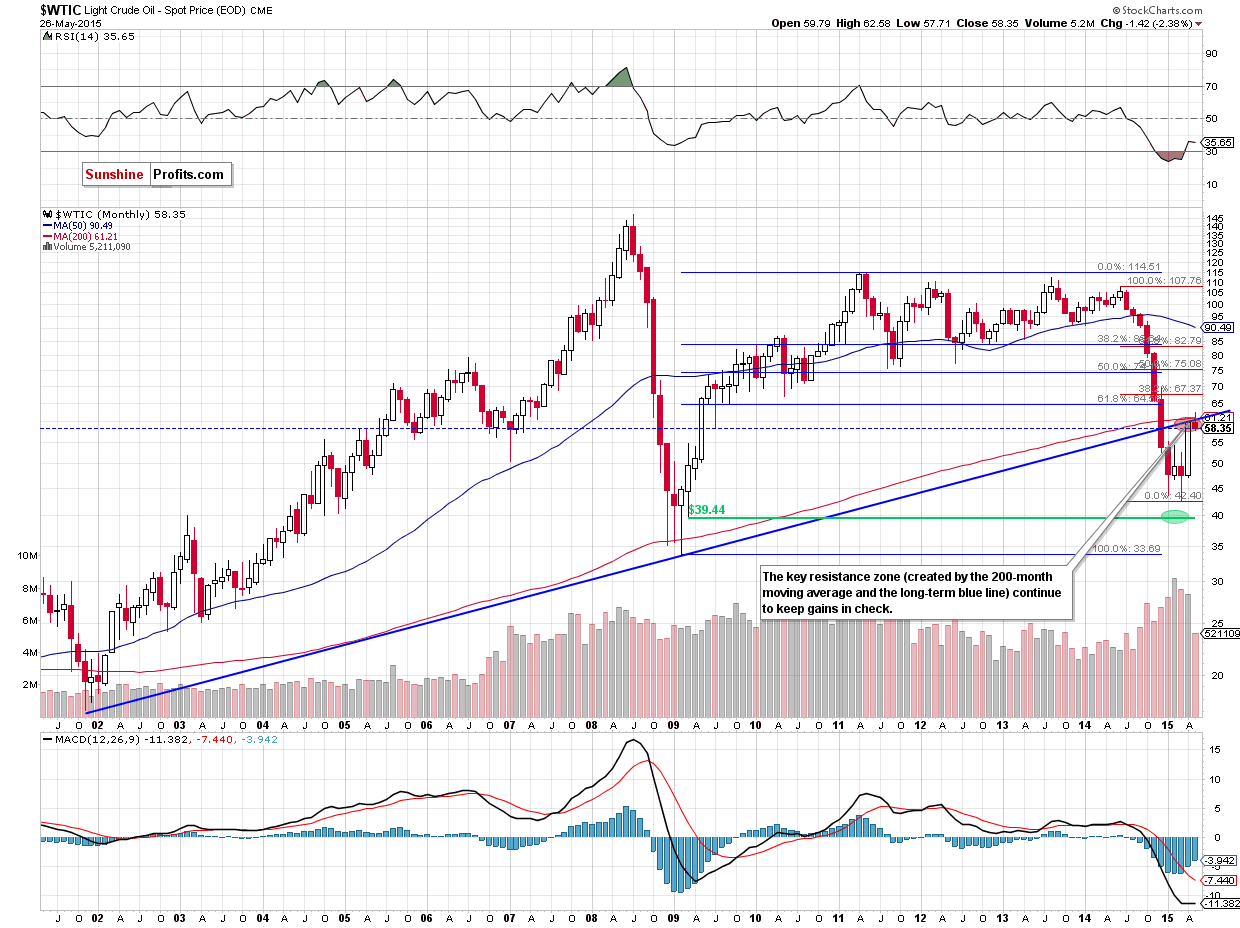
Additionnaly, looking at the chart from the long-term perspective, it seems that crude oil verified the move to the previously broken rising support/resistance line and is now about to slide further. In ur opinion, as long as there is no breakout above this area, higher values of the commodity are not likely to be seen and further deterioration is more likely than not.
On op of that, there are also bearish signals on the weekly chart.
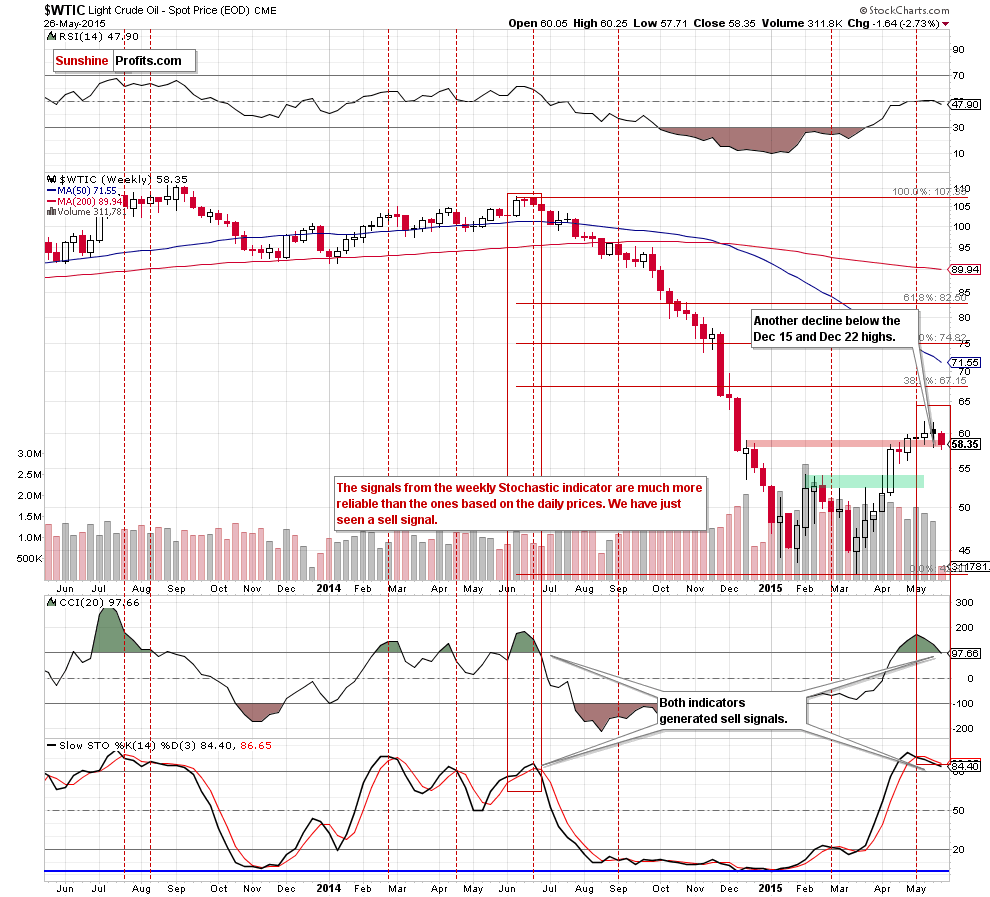
From this perspective, we see that yesterday’s downswing invalidated earlier breakout above the Dec 15 and Dec 22 highs. Although we saw similar price action in the previous weeks, this time oil bears gained another factors, which could accelerate further declines – sell signals generated by the CCI and Stochastic Oscillator.
What does it mean for the commodity? We think that the best answer to this question will be the quote from our previous Oil Trading Alert:
(...) The efficiency of the indicator’s sell signals (something that we just saw) is quite high. By a sell signal we mean a situation when the indicator breaks below its average while being above the 80 level (overbought).
What’s even more interesting is that the last time that we saw this kind of sell signal was when crude oil was trading above $100. Since we saw this kind of signal once again recently, it serves as a subtle clue that perhaps crude oil has corrected enough and is now ready to fall much further (or to the previous lows).
Taking all the above into account, we believe that even if crude oil moves little higher from here, lower values of the commodity are ahead us. If this is the case, and oil bears push light crude below the green support line based on the May lows (the neck line of the formation - currently around $57.70), the current decline will accelerate and we’ll see a drop to the 38.2% Fibonacci retracement (based on the entire Mar-May rally) or the green support zone created by the Feb highs (in this area the size of the downward move will correspond to the height of the rising wedge – marked with blue).
Summing up, crude oil moved sharply lower and reached the the neck line of the head and shoulders formation once again. Although the commodity could rebound from here (simiarly to what we saw in the previous weeks), we believe that the space for further gains is limited and a breakdown below the neck line of the formation is only a matter of time (especially when we factor in sell signals generated by the weekly indicators).
Very short-term outlook: bearish
Short-term outlook: bearish
MT outlook: mixed with bearish bias
LT outlook: mixed with bearish bias
Trading position (short-term; our opinion): Short positions with a stop-loss order at $65.23 are justified from the risk/reward perspective. We will keep you – our subscribers – informed should anything change.
Thank you.
Nadia Simmons
Forex & Oil Trading Strategist
Przemyslaw Radomski, CFA
Founder, Editor-in-chief
Gold & Silver Trading Alerts
Forex Trading Alerts
Oil Investment Updates
Oil Trading Alerts

