

Trading position (short-term; our opinion): No positions are justified from the risk/reward perspective.
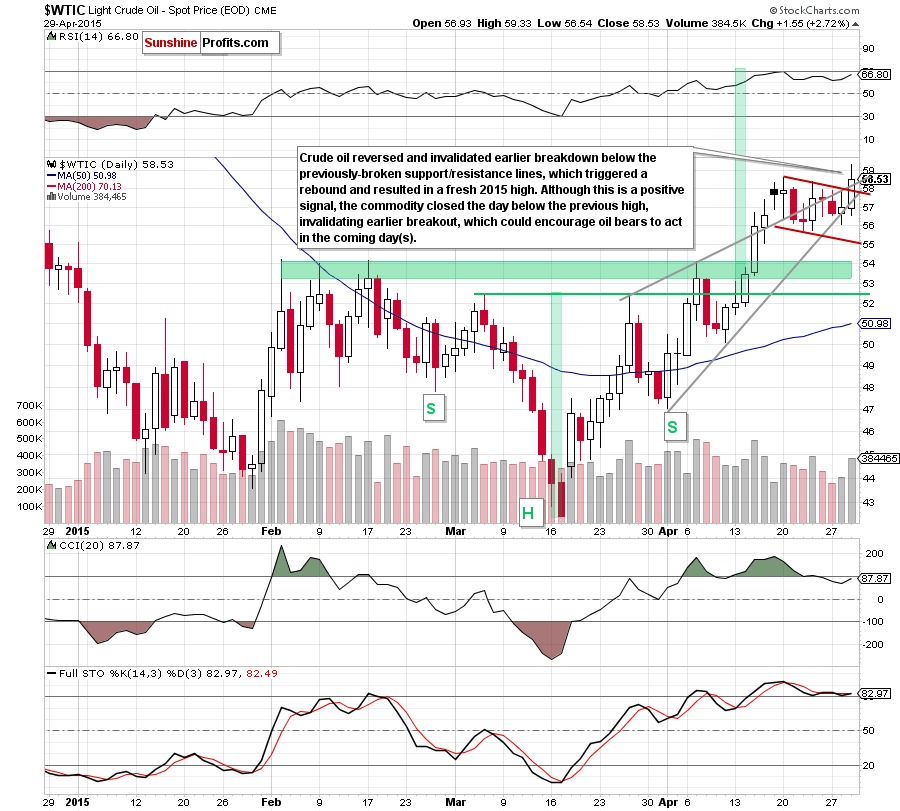
On Wednesday, crude oil gained 2.72% as smaller-than-expected build in crude oil inventories in combination with a weaker greenback and ongoing tensions in the Middle East supported the price. Thanks to these circumstances, light crude reversed and hit a fresh 205 high. Will we see higher values of the commodity in the coming days?
Yesterday, the Commerce Department showed that U.S. gross domestic product increased only by 0.2% in the first quarter, slowing from 2.2% in the fourth quarter of 2014. This slowest rate of growth in a year pushed the USD Index well below 96, making crude oil more attractive for buyers holding other currencies.
Additionally, the Energy Information Administration reported that crude inventories increased by 1.9 million barrels for the week that ended April 24, which was far below forecast of a 3.3 million barrel increase. On top of that, crude oil supplies at the Cushing Oil Hub in Oklahoma declined by 514,000, also well below estimates of a 400,000 gain. At this point, it is worth noting that it was the first drop since last November, which in combination with smaller-than-expected build in crude oil inventories encouraged oil bulls to act and resulted in a fresh 2015 high of $59.33. Will the commodity break above $60 in the coming days? (charts courtesy of http://stockcharts.com).
In our previous alert, we wrote the following:
(…) the American Petroleum Institute reported that domestic crude oil inventories increased by 4.2 million barrels last week. If today’s EIA report confirms another build in inventories, the realization of the bearish scenario will be more likely. Nevertheless, we should keep in mind that lower reading could push the price of crude oil higher.
As we have pointed out before, yesterday’s EIA weekly report showed smaller-than-expected build in crude oil inventories, which encouraged oil bulls to act. As a result, crude oil reversed and rebounded, invalidating earlier breakdown below the lower and upper line of the rising wedge and the upper border of the very short-term declining trend channel. These positive signals triggered further improvement and resulted in a fresh 2015 high of $59.33.
Is this upswing as bullish as it seems? At the first sight, the answer is yes. Nevertheless, when we take a closer look at the daily chart, we see that the commodity reversed and closed the day below the previous high, invalidating earlier breakdown. Additionally, the size of volume that accompanied yesterday’s increase is quite small (compared to what we saw in mid-Apr), which doesn’t confirm oil bulls’ strength. At this point, it is also worth noting that there are negative divergences between the RSI, CCI, Stochastic Oscillator and the commodity (while most of sell signals remain in place), which is a negative signal. All the above doesn’t bode well for crude oil and suggests that the space for further growth might be limited – especially when we factor in the long- and medium-term picture.
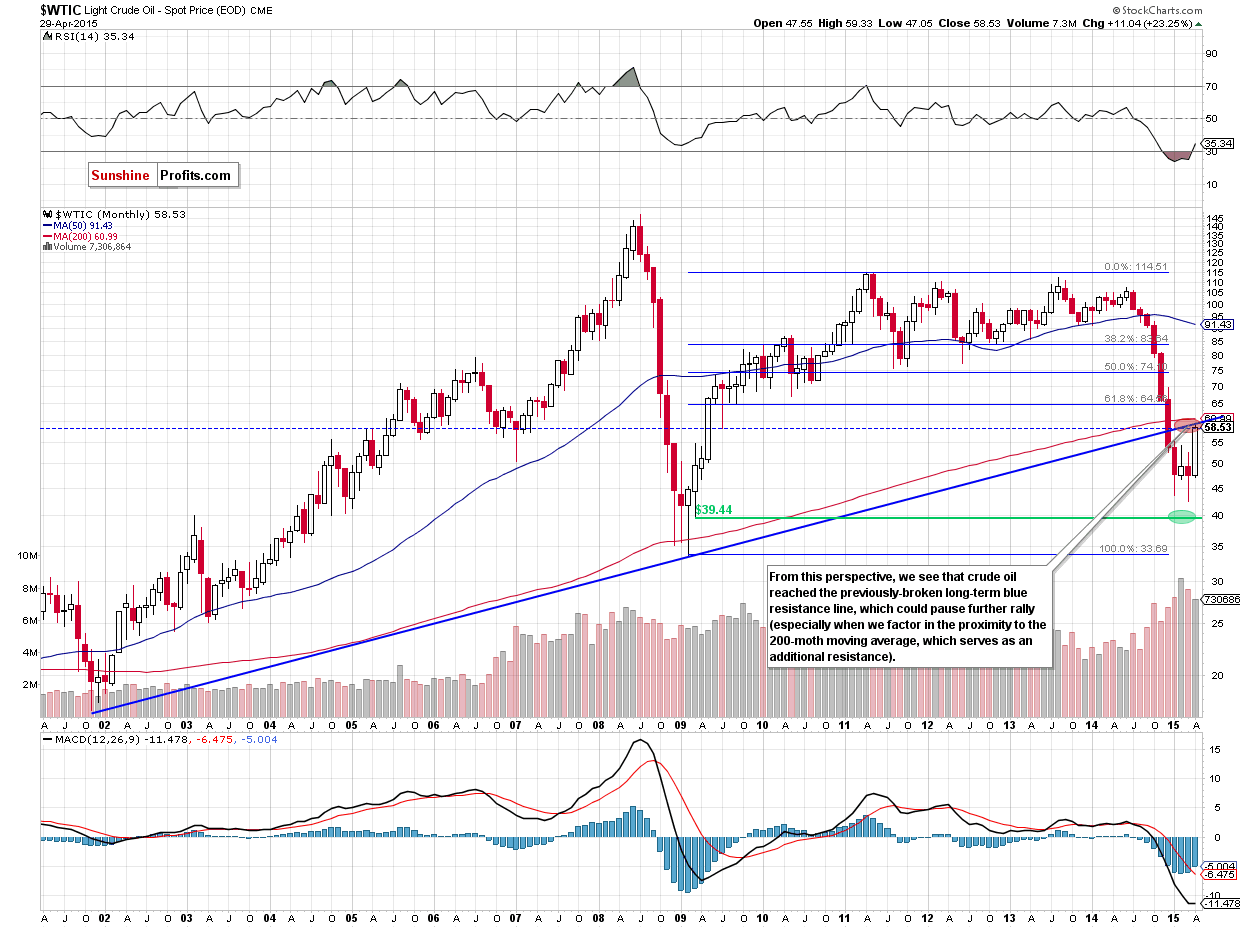
From the monthly perspective, we see that crude oil reached the previously-broken long-term blue resistance line, which could pause further rally in the near future (especially when we take into account the proximity to the 200-mont moving average, which serves as an additional resistance).
Did yesterday’s upswing change the medium-term picture? Let’s examine the weekly chart and find out.
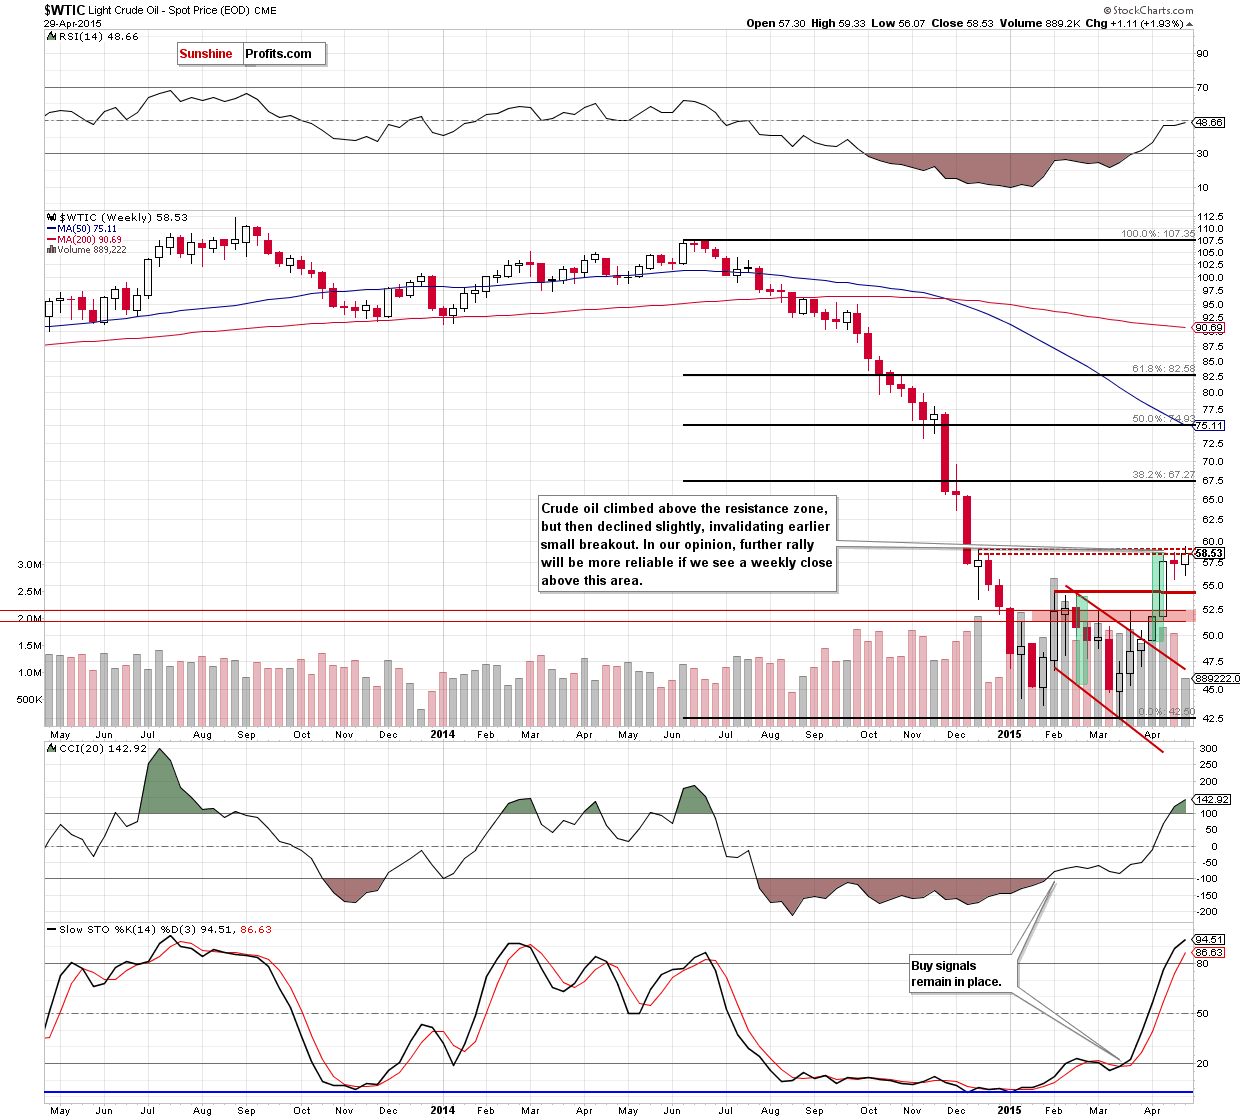
Looking at the weekly chart, we see that although crude oil climbed above the resistance zone (created by the Dec 15 and Dec 22 highs), this improvement was only temporary and the commodity reversed, invalidating earlier small breakout. This is a negative signal, which in combination with the current position of the indicators (the CCI and Stochastic Oscillator are overbought) suggests that reversal is just around the corner (even if oil bulls try to push light crude higher and test the barrier of $60).
Therefore, we think that as long as there is no breakout above this area (and resistance zone marked on the monthly chart) further rally is not likely to be seen.
Summing up, crude oil extended gains and hit a fresh 2015 high, which was the most important event of yesterday’s session. Despite this improvement, the solid resistance zone (created by the mid-Dec high, the long-term blue resistance line and the 200-month moving average) still keeps gains in check, which in combination with yesterday’s invalidation of the breakout above the previous high and the size of volume that accompanied the upswing could encourage oil bears to act in the coming days.
Very short-term outlook: mixed with bearish bias
Short-term outlook: mixed
MT outlook: mixed
LT outlook: bullish
Trading position (short-term; our opinion): No positions are justified from the risk/reward perspective at the moment, but we will keep you informed should anything change.
On an administrative note, please note that there will be no Oil Trading Alerts tomorrow. The next alert will be posted on Monday, May 4. Thank you for your understanding.
Thank you.
Nadia Simmons
Forex & Oil Trading Strategist
Przemyslaw Radomski, CFA
Founder, Editor-in-chief
Gold & Silver Trading Alerts
Forex Trading Alerts
Oil Investment Updates
Oil Trading Alerts

