

Trading position (short-term; our opinion): No positions are justified from the risk/reward perspective.
On Tuesday, crude oil declined sharply as speculations about weekly supply data weighed on the price. As a result, light crude lost 2.80% and invalidated one of earlier breakouts. What does it mean for the commodity?
A week ago, crude oil increased sharply and broke above the Feb highs after the EIA reported that crude oil supplies increased by only 1.3 million barrels (compared to the data released on Apr 8, which showed that inventories rose by 10.95 million – it was the largest weekly build in domestic oil inventories since). That bullish report eased concerns that the U.S. will reach full storage capacity before the end of May and supported further improvement.
Nevertheless, Friday’s Baker Hughes report (which showed that oil rigs in the U.S. fell by only 26 in the previous week, suggesting that the pace of decline appears to be slowing) renewed the above-mentioned concerns and raised speculation that weekly supply data would show another increase in domestic crude oil inventories. In this environment, light crude declined sharply and invalidated one of earlier breakouts, slipping below $57. Will we see a test of the Feb highs in the coming days? (charts courtesy of http://stockcharts.com).
In our previous Oil Trading Alert, we wrote the following:
(…) yesterday’s increase took crude oil to the resistance zone marked on the above chart (…) in this area the size of the upward move corresponds to the height of the declining trend channel (…), which could encourage day traders to take profits and trigger a pullback (please note that slightly lower is also the mid-Dec high of $59.04) (…)
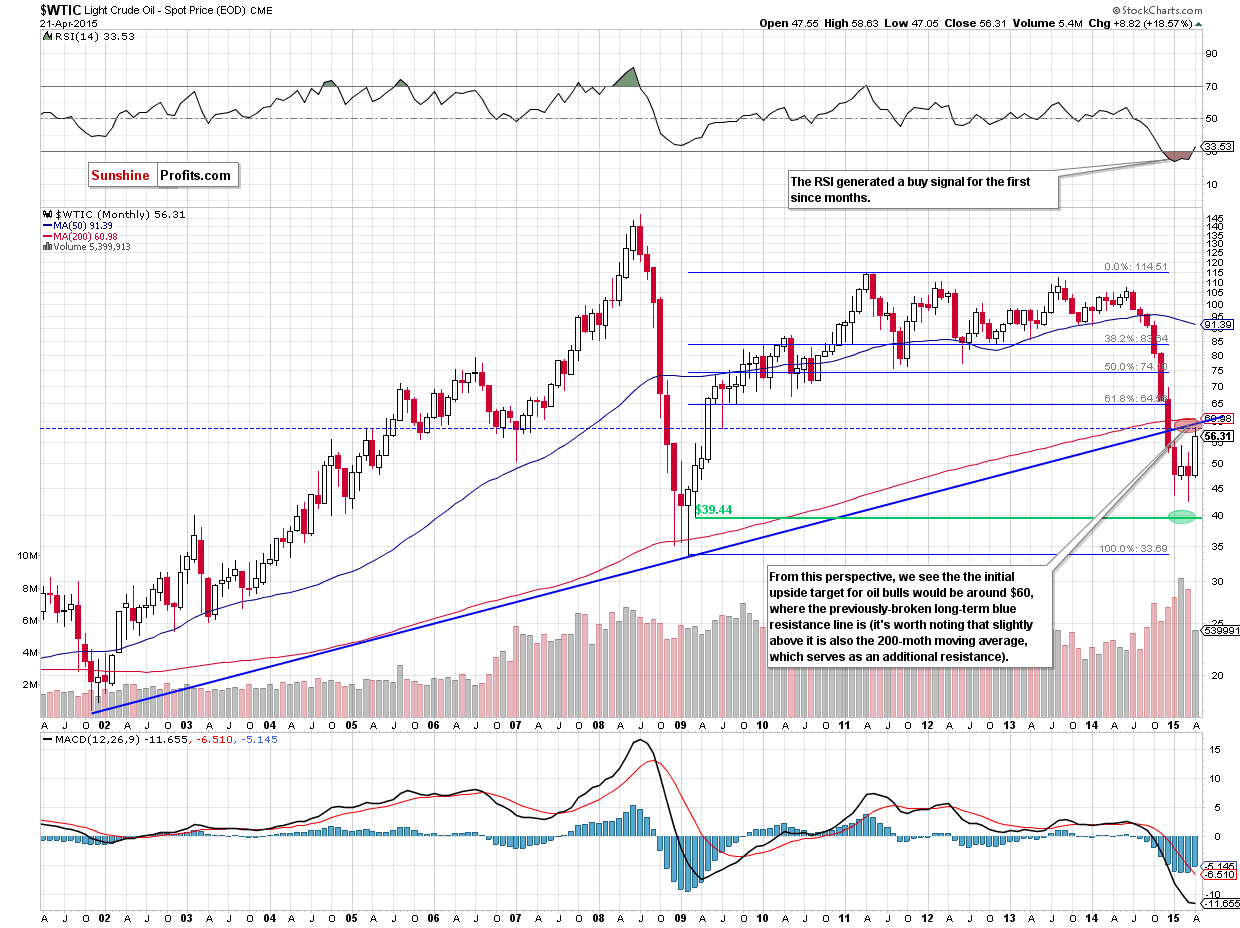
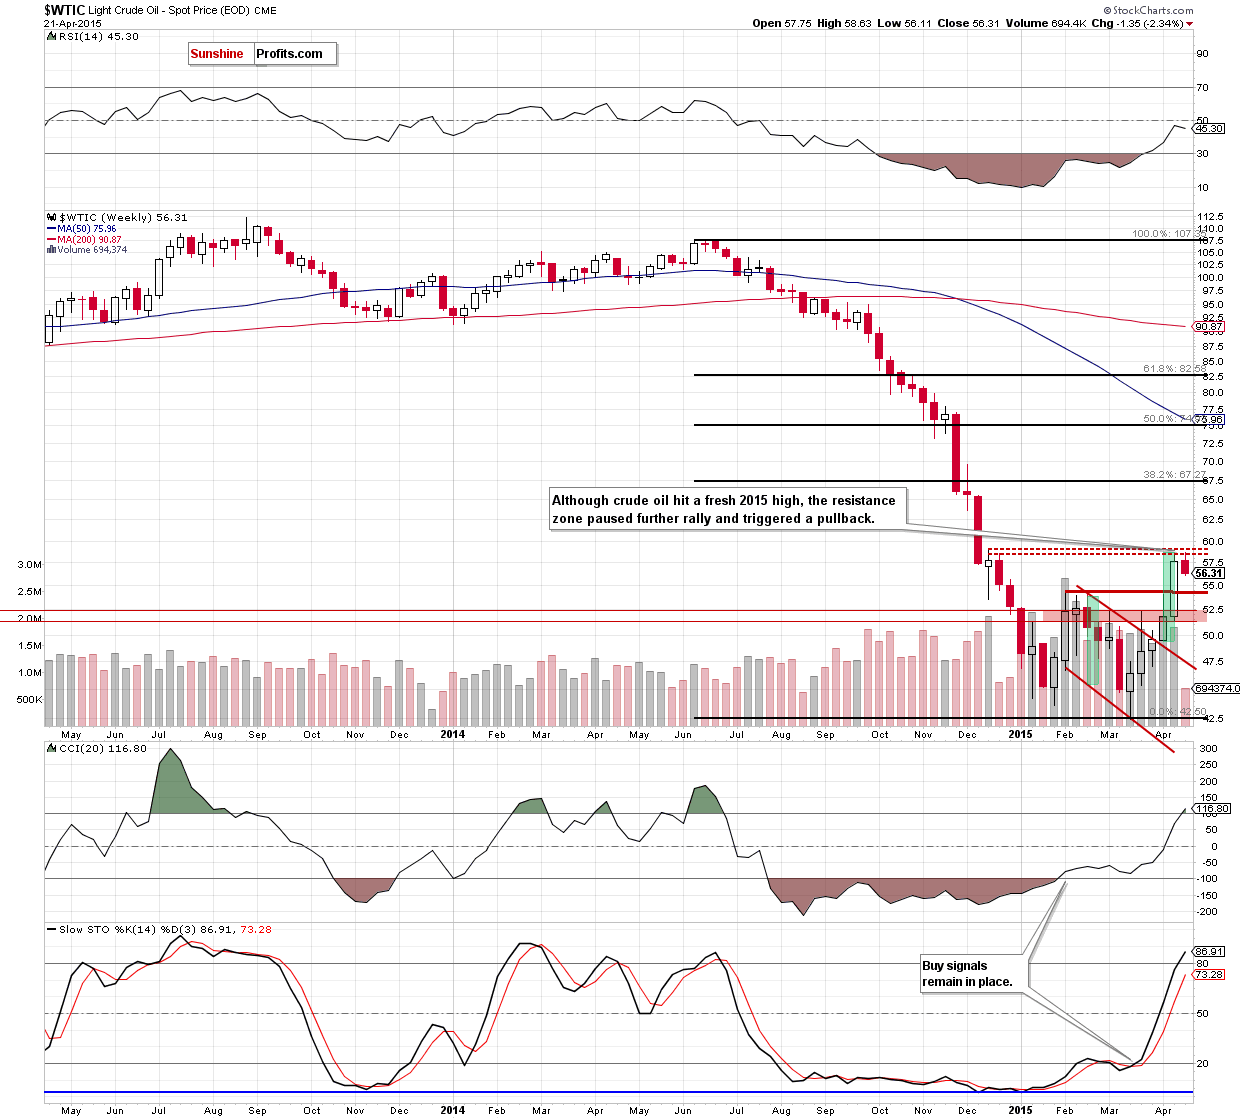
Looking at the weekly chart, we see that the above-mentioned resistance zone in combination with the proximity to the 200-month moving average (that stopped major declines 2 times: in 2001 and 2008/2009) and the very long-term rising resistance line (based on 2001 and 2009 bottoms) encouraged oil bears to act as we expected. As a result, crude oil gave up some gains (from ths perspective we see that the pullback is quite shallow at the moment) and slipped under $57.
How did this decline affect the very short-term picture? Let’s examine the daily chart and find out.
Quoting our last commentray:
(…) is this increase as bullish as it seems? At first glance, the answer is yes. However, when we take a closer look at the above chart, we see that the size of volume that accompanied yesterday’s upswing was quite small (compared to what we saw in the previous week). Additionally, the CCI and Stochastic Oscillator are overbought, while the RSI approached the level of 70, suggesting that a reversal is just around the corner – especially when we factor in the proximity to the strong resistance zone between $58.53 (the Dec 22 high) and $60.99 (the 200-month moving average).
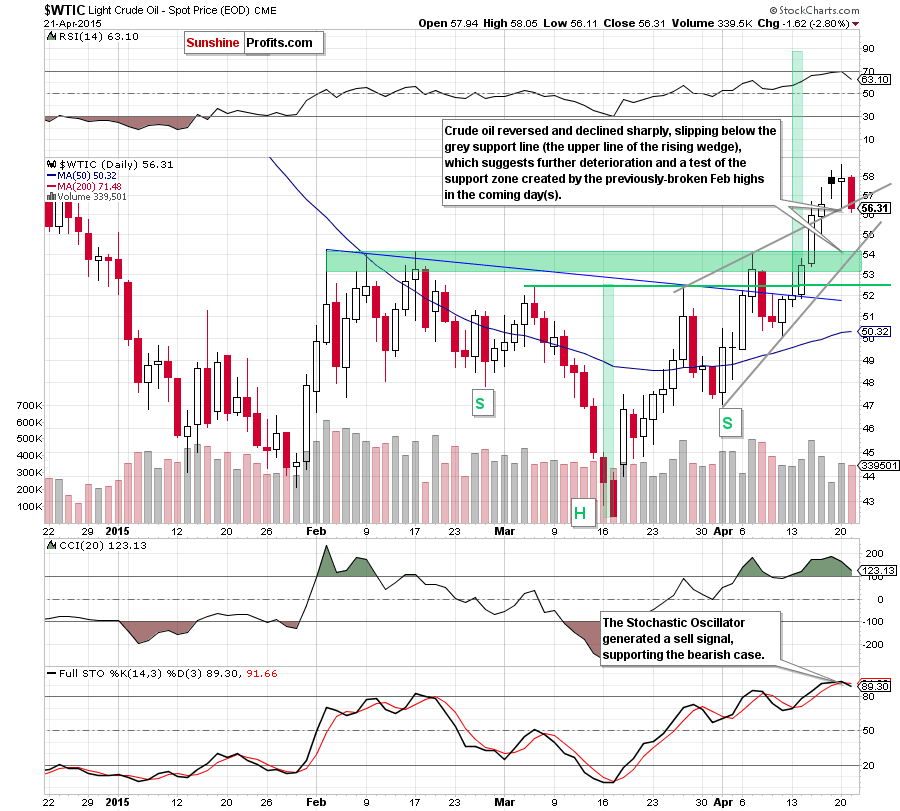
Taking all the above into account, we think that crude oil will correct the recent rally in the coming day(s). In this case, the initial downside target for oil bears would be around $56.70, where the previously-broken upper line of the rising wedge (marked on the daily hart) is.
From this perspective, we see that the situation developed in line with the above scenario and crude oil not only reached our downside target, but also closed the day below the grey support line. This is a negative signal, which suggests further deterioration (especially when we fctor in sell signals generated by the RSI and Stochastic Oscillator). If this is the case, and light crude moves lower in the coming day(s), we’ll see a drop to the support zone created by the Feb highs (around $54.15-$54.24) and the lower line of the rising wedge.
Before we summarize today’s alert please note that the American Petroleum Institute reported that domestic crude oil inventories increased by 5.5 million barrels last week, distillate inventories rose by 1.7 million barrels, while gasoline supplies increased by 1.1 million barrels. If today’s EIA report confirms these numbers, the realization of the bearish scenario will be more likely. Nevertheless, we should keep in mind that lower reading could push the price of crude oil higher and invalidate yesterday’s breakdown later in the day.
Summing up, crude oil reversed and declined sharply, invalidating earlier breakout above the upper line of the rising wedge. This is a negative signal, which in combination with sell signals generated by the RSI and Stochastic Oscillator suggests further deterioration and a test of the support zone created by the Feb highs and the lower line of the rising wedge (around $54.15-$54.24).
Very short-term outlook: mixed with bearish bias
Short-term outlook: mixed
MT outlook: mixed
LT outlook: bullish
Trading position (short-term; our opinion): No positions are justified from the risk/reward perspective at the moment, but we will keep you informed should anything change.
Thank you.
Nadia Simmons
Forex & Oil Trading Strategist
Przemyslaw Radomski, CFA
Founder, Editor-in-chief
Gold & Silver Trading Alerts
Forex Trading Alerts
Oil Investment Updates
Oil Trading Alerts

