

Trading position (short-term; our opinion): No positions are justified from the risk/reward perspective.
Although crude oil declined after the market’s open weakened by Saudi oil minister commentary, the commodity rebounded as the Genscape report supported the price. Thanks to these circumstances, light crude gained 3.32% and hit a fresh 2015 high. Will we see further improvement?
Yesterday, Saudi oil minister Ali al-Naimi said that the country was expected to produce around 10 million barrels per day (near record highs) in April, which fuelled worries over the supply glut and pushed the commodity below $57. Despite this deterioration, light crude reversed and rebounded sharply as Genscape, Inc. showed in its report that crude-oil stockpiles in Cushing rose by less than 500,000 barrels last week, which was a smaller increase than has been typical in recent months. Additionally, the firm reported that Cushing stockpiles fell in the second half of last week, which eased concerns that the U.S. could reach full supply capacity before the start of the summer driving season. As a result, the commodity extended last week’s rally and hit a fresh 2015 high of $58.63. Will we see further improvement? (charts courtesy of http://stockcharts.com).
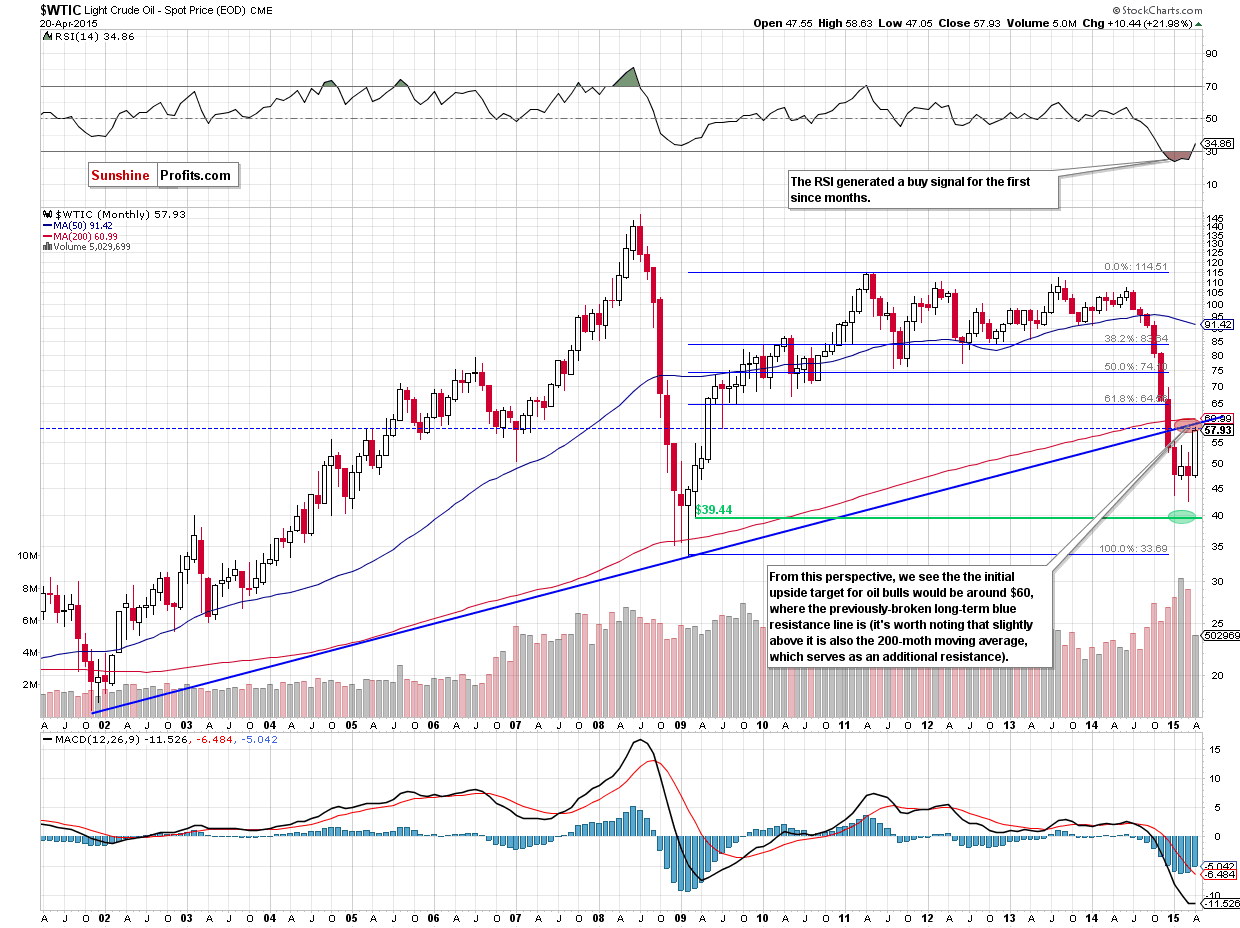
The situation in the long term hasn’t changed much as crude oil is still trading below the resistance zone created by the 200-month moving average (that stopped major declines 2 times: in 2001 and 2008/2009) and the very long-term rising resistance line based on 2001 and 2009 bottoms.
Did yesterday’s upswing affect the medium-term picture? Let’s examine the weekly chart and find out.
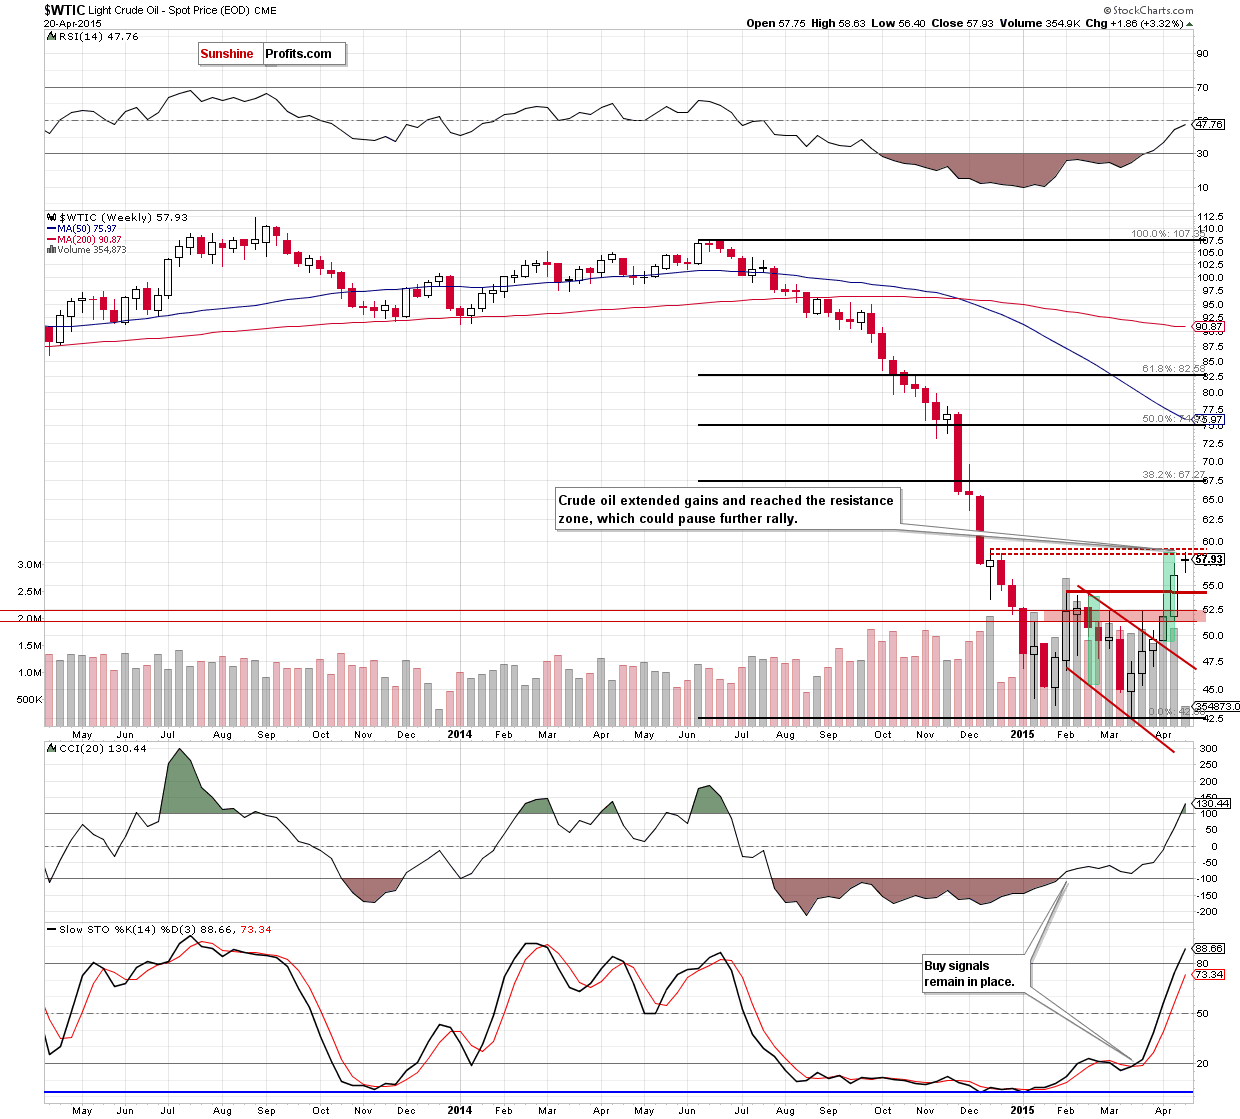
From this perspective, we see that esterday’s increase took crude oil to the resistance zone marked on the above chart. What does it mean for the comodity? We think that the best answer to this question will be a quote from our Friday’s alert:
(…) in this area the size of the upward move will correspond to the height of the declining trend channel (…), which could encourage day traders to take profits and trigger a pullback (please note that slightly lower is also the mid-Dec high of $59.04) (…)
Are there any short-term facors that could support the realization of the above scenario? Let’s check what can we infer from the daily chart.
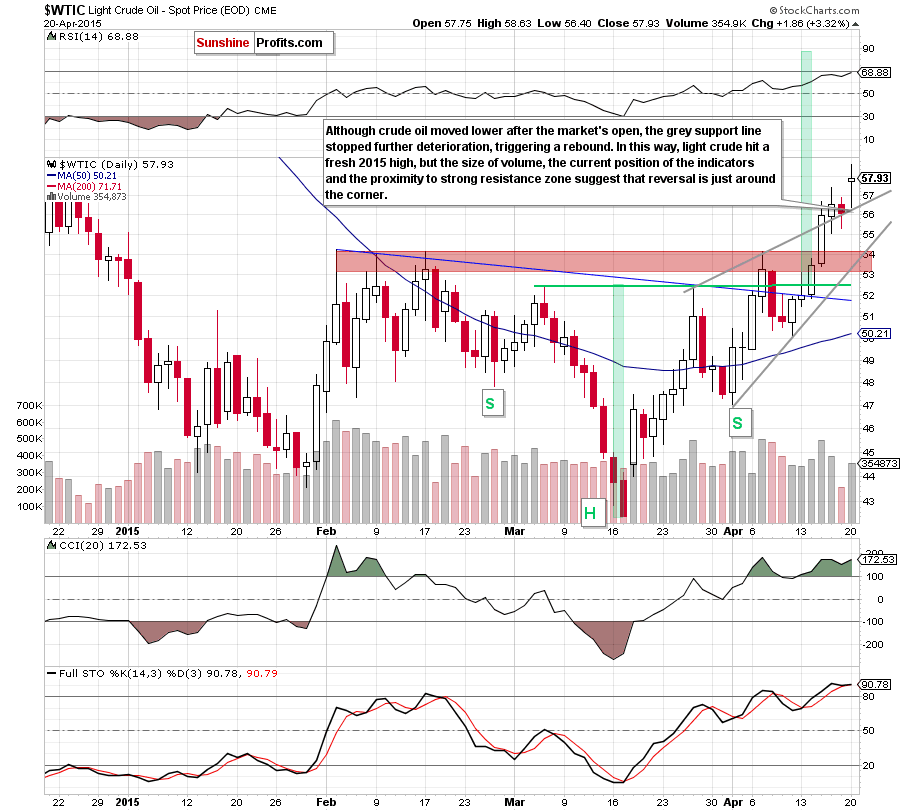
On the daily chart, we see that although crude oil moved lower after the market’s open, the grey support line stopped further deterioration, triggering a rebound, which took the commodity to a fresh 2015 high.
But is this increase as bullish as it seems? At first glance, the answer is yes. However, when we take a closer look at the above chart, we see that the size of volume that accompanied yesterday’s upswing was quite small (compared to what we saw in the previous week). Additionally, the CCI and Stochastic Oscillator are overbought, while the RSI approached the level of 70, suggesting that a reversal is just around the corner – especially when we factor in the proximity to the strong resistance zone between $58.53 (the Dec 22 high) and $60.99 (the 200-month moving average).
Taking all the above into account, we think that crude oil will correct the recent rally in the coming day(s). In this case, the initial downside target for oil bears would be around $56.70, where the previously-broken upper line of the rising wedge (marked on the daily hart) is. If light crude invalidates breakout above this line, it would be a negative signal, which will accelerate decline and trigger a drop to the support zone created by the Feb highs (around $54.15-$54.24) or even to the lower line of the formation (currently around $53).
Summing up, crude oil extended gains and hit a fresh 2015 high, approaching the strong resistance zone (created by the mid-Dec highs, the 200-month moving average and the very long-term rising resistance line based on 2001 and 2009 bottoms). Taking this fact into account, and combining it with the current position of daily indicators, we think that correction of the recent rally in the coming day(s) is more likely than not. If this is the case, the initial downside target would be around $56.70 (the previously-broken upper line of the rising wedge).
Very short-term outlook: mixed
Short-term outlook: mixed
MT outlook: mixed
LT outlook: bullish
Trading position (short-term; our opinion): No positions are justified from the risk/reward perspective at the moment, but we will keep you informed should anything change.
Thank you.
Nadia Simmons
Forex & Oil Trading Strategist
Przemyslaw Radomski, CFA
Founder, Editor-in-chief
Gold & Silver Trading Alerts
Forex Trading Alerts
Oil Investment Updates
Oil Trading Alerts

