
Trading position (short-term; our opinion): Short positions are justified from the risk/reward perspective.
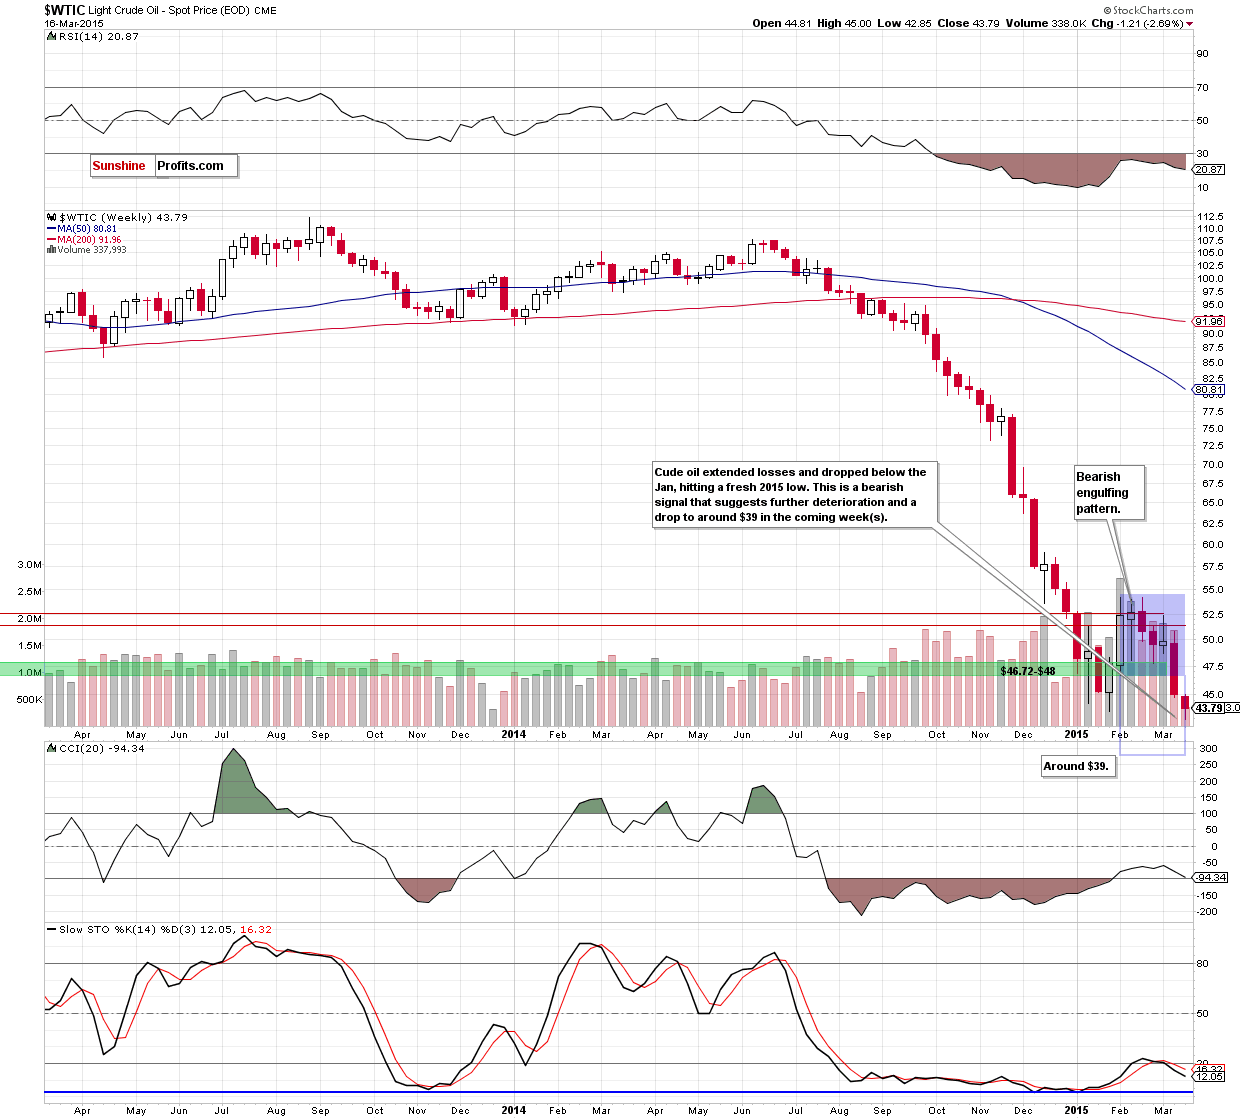
On Monday, crude oil lost 2.69% as OPEC monthly report weighed on the price. As a result, light crude extended losses and dropped to a fresh 2015 low. How low could the commodity go in the coming days?
Yesterday, OPEC in its monthly report cut forecast for demand for its own oil in 2015 to 29.19 million barrels a day, down 100,000 barrels from a previous estimate. The cartel also left its 2015 estimate for non-OPEC supply growth at 420,000 barrels a day and warned that output in the U.S. might only start to be curbed towards the end of the year. In these circumstances, light crude extended losses and hit a fresh 2015 low of $42.85. Will the commodity test the barrier of $40 in the coming days? (charts courtesy of http://stockcharts.com).
Yesterday, we wrote the following:
(…) light crude also declined below the lower border of the green support zone based on the Apr 2009 lows, which is a strong negative signal that suggests a test of the Jan low.
Looking at the weekly chart, we see that oil bears not only took crude oil to this important support level, but also managed to push the commodity below it, hitting a fresh 2015 low. What’s next? Taking the above into account, and combining it with the breakdown under the lower border of the consolidation (marked with blue) and a sell signal generated by the Stochastic Oscillator, we think that lower values of light crude are still ahead us.
How low could the commodity go? We believe that the best answer to this question will be a quote for our yesterday’s Oil Trading Alert:
(…) Taking this bearish event into account, it seems that we could see a fresh 2015 low around $39, where the size of the downward move will correspond to the height of the formation.
At this point, it’s worth noting that if oil bulls won’t be able to hold this level, the next target for the commodity would be around $37-$37.65. Why there? Let’s zoom out our picture and find out.
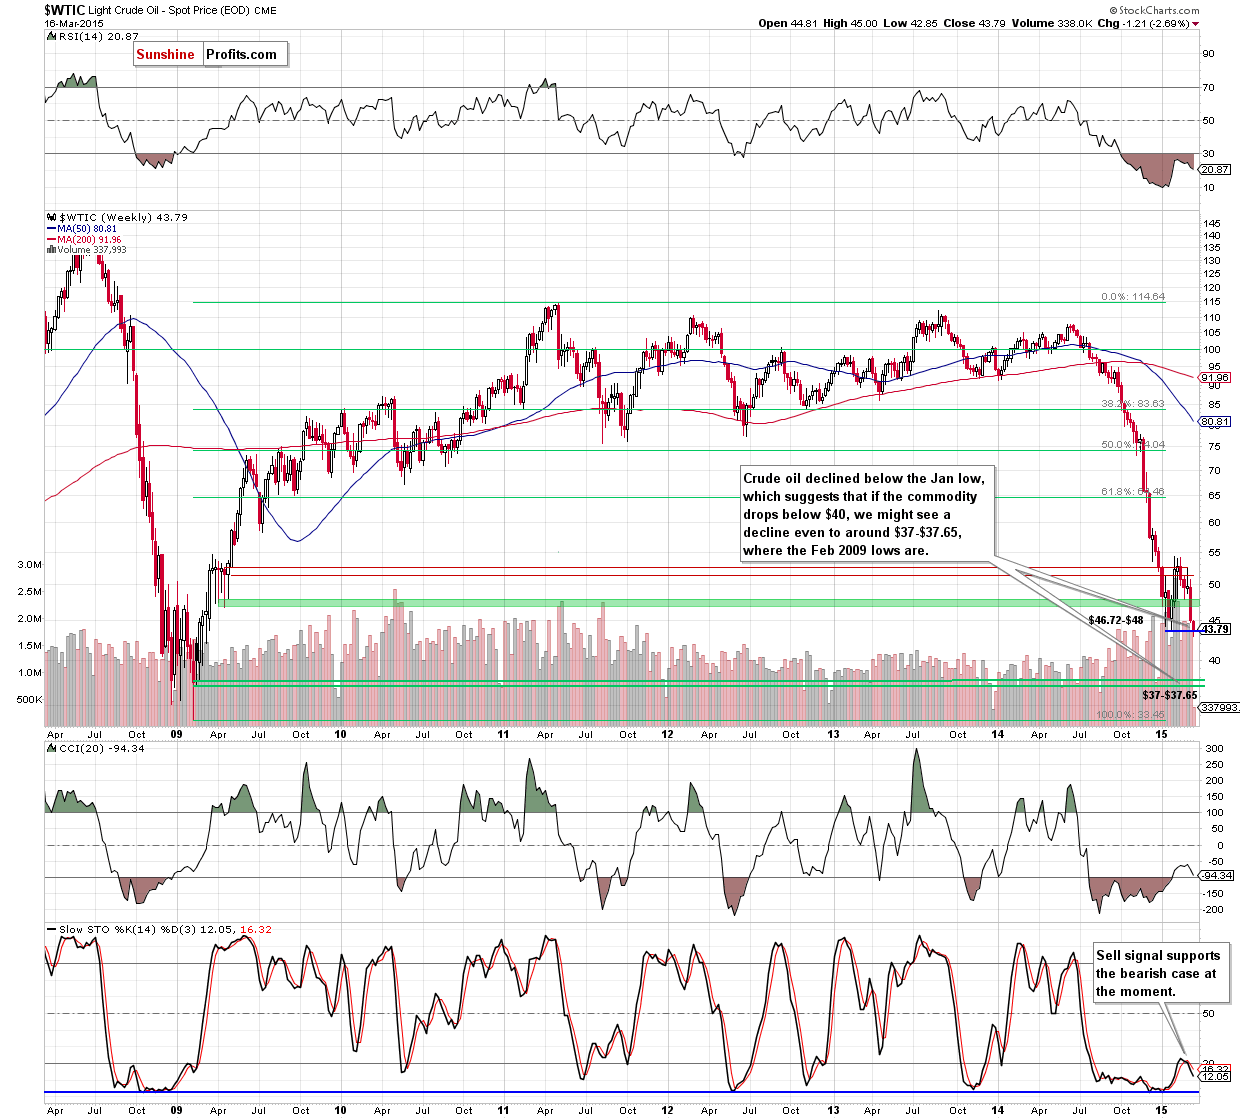
From this perspective, we see that the last pause before the 2009 low of $33.55 is the above-mentioned area, where the Feb 2009 lows are (please note that this zone is also reinforced by the 161.8% Fibonacci extension based on the Jan-Feb upward move).
Summing up, the highlight of yesterday’s session was the breakdown under the Jan low and a fresh 2015 low of $42.85. In our opinion, this is a strong bearish signal that suggests further deterioration and a drop to at least $40 in the coming day(s).
Very short-term outlook: bearish
Short-term outlook: mixed
MT outlook: mixed
LT outlook: bullish
Trading position (short-term; our opinion): Short positions with a stop loss order at $46.10 are justified from the risk/reward perspective. We will keep you informed should anything change.
Thank you.
Nadia Simmons
Forex & Oil Trading Strategist
Przemyslaw Radomski, CFA
Founder, Editor-in-chief
Gold & Silver Trading Alerts
Forex Trading Alerts
Oil Investment Updates
Oil Trading Alerts

